Chapter 2
Electron Acceleration in Solar Flares

This chapter will review the mechanisms and processes that have been proposed for the acceleration of electrons to high energies in solar flares. It describes the observational constraints placed on electron acceleration mechanisms in solar flares. It then describes a range of acceleration mechanisms and discusses their application to various models of electron acceleration in solar flares. To put this thesis into context, we discuss the formation of fast mode shocks in solar flares, and the various shock acceleration mechanisms. We reconcile shocks as an acceleration mechanism with observational constraints and show that comparisons with the Earth's bow shock are valid.

2.1  Solar Flares

A solar flare is an explosive release of magnetic energy in the Sun's corona. Flares originate in areas where Ha emission is particularly intense, called active regions. They start as loops of plasma (flux tubes) rising out of the photosphere which erupt, heating the plasma and accelerating particles to high energies on time scales as short as a few seconds.
The total magnetic energy involved is large compared to the amount of plasma in the flare loop. If the total magnetic energy in a flare is divided amongst the particles, and if this plasma were allowed to reach equilibrium, it would have a temperature of around 108 K [Benz, 1996]. This compares to a typical coronal temperature of around 106 K. A flare therefore accelerates particles to very high energies in a short time. The mechanism or mechanisms by which this occurs are still a matter of debate.
Furthermore, the mechanism by which flares are triggered, and the conditions in which they form, are still not completely understood. The phenomenon of sympathetic flares, where the eruption of a flare on one part of the Sun appears to trigger a flare in a completely different region, shows that different areas of the Sun are magnetically linked. This also suggests that an input of energy may be sufficient to trigger a developing flare. One proposal is that the energy release behaves as a self organised critical system, suggesting that flares themselves may be composed of many small regions of accumulated magnetic energy. According to this theory, once the accumulation of energy in one of these regions reaches some critical threshold, the region will undergo a rapid change of magnetic topology, presumably due to reconnection, erupt and release its energy. This energy release will then provide the catalyst for adjacent regions to erupt, eventually producing a cascade of energy release sites that becomes a flare. A significant feature of this theory is that it operates independently of the actual energy release mechanism. Fragmented energy release is discussed in Section 2.3.2.

2.1.1  Classification

Although solar flares were first observed in white light, they have been observed at frequencies across the electromagnetic spectrum. Initially, optical telescopes were used to image flares using the Ha emission line. This led to an importance classification for solar flares [IAU, 1966] that depended on the area and relative intensity of Ha emission. Now that we have spacecraft which observe the Sun at a range of frequencies, flare classification may also be based on soft X-ray intensity. This is claimed to provide a more profound insight into flare phenomena, as well as allowing the classification of the widest possible range of flares. In particular, electron acceleration is a high energy process and the X-ray intensity is likely to tell us much more about such processes than the visible light diagnostics.
Flares are often classified according to the soft X-ray flux observed by Earth-orbiting satellites, such as the GOES series. The scheme shown in Table 2.1 uses the soft X-ray flux in the wavelength range 1 to 8 Å. Flares are classified using a letter followed by a number, where the letter represents an order of magnitude, as shown in the table, and the number represents a multiple of that value. For example, an M4 flare has an intensity of 4 ×10⁻² erg  cm-2  s-1. In the case of a sub-B class flare, the letter B may be multiplied by a decimal, so that a flare with an intensity of 3 ×10⁻⁵ erg  cm-2  s-1 would be classified as B.3.
Class Intensity (erg  cm-2  s-1)
B 10-4
C 10-3
M 10-2
X 10-1
Table 2.1: The GOES classification scheme for solar flares using soft X-rays in the wavelength range 1 to 8 Å.
Ohki et al. [1983] classified flares as either gradual or impulsive, according to their hard X-ray (HXR) signatures. Gradual flares produce a long duration ( >~10 min) power law X-ray spectrum. Impulsive flares produce X-rays for a much shorter time and with an initial exponential spectrum, followed by a power law profile. The emission from gradual flares was found to come from a large source high in the corona, whereas impulsive flare emission comes from a variety of source sizes and is lower in the corona. Ohki et al. [1983] suggested that two different acceleration and emission mechanisms are responsible for the two different types of HXR emission.
Flares may also be classified according to the duration of their soft X-ray emission. Sheeley et al. [1983] found that flares whose X-ray emission lasted more than about 6 hours are always associated with significant ejections of plasma into the solar wind known as Coronal Mass Ejections (CMEs). The number of flares without associated CMEs increases rapidly as the emission duration falls in the interval 2 - 5 hours. These Long Duration X-ray events are referred to as LDEs.
The current trend, however, is not to view flares as belonging to different types, with distinct physical processes. Crosby et al. [1993] and Bromund et al. [1995] measured a variety of HXR flare parameters for a sample of several thousand flares, including peak photon flux, peak electron power, total electron energy and total duration. They found that, except for the largest flares, the statistical distributions of these parameters follow a power law. If there were physically distinct classes of flare, each with parameters following a power law, the overall power law distribution of parameters would be broken. This suggests that, although two different flares may appear to be different, the underlying physical processes are the same. In building a physical model for flares, therefore, it makes sense to concentrate on the similarities between flares, rather than the differences.

2.1.2  Two ribbon flare model

The two ribbon flare model of Sturrock [1966], Hirayama [1974] and Kopp & Pneuman [1976] is a standard model of flare physics and, although it is generally agreed to be very simplified, it provides a good basis for discussion. In a two-ribbon flare, the geometry is dominated by the presence of a reconnection point above the emerging flux tube. As the flux tube rises, the overlying arcade of magnetic field reconnects with the coronal field.
The evolution of a flare is typically divided into three stages. The duration of these phases can be determined observationally, although the underlying physical processes must be inferred from the model. During the pre-flare phase, which typically lasts about half an hour, a flux tube from an active region and its overlying arcade of magnetic field rises slowly from the photosphere. The start of the rise phase, which lasts between about 5 minutes and an hour, comes when the stretched field lines start to reconnect. The flare then begins to erupt and reconnection occurs rapidly. This is the most violent stage, from which we expect the most energetic particles to originate. A substantial fraction of the total flare energy is dumped into <~ 100 keV electrons [Benz, 1996]. The acceleration mechanisms active during this phase are poorly understood.
Interplanetary energetic particles (ions and electrons) appear on time scales >~100s after the peak of the impulsive phase. Only some of the field lines in a flare connect to interplanetary space, so the flare geometry will affect which electrons can escape. The flare may also launch an interplanetary shock into the solar wind that can accelerate the escaping electrons further. Those electrons that do not interact with a shock will propagate outwards freely, without much change in energy.
The decay phase of a flare lasts between and hour and a day or so, during which the observed intensity of the flare slowly declines. Field line reconnection continues, creating hot X-ray loops. The continued observations of energetic particles suggest that either they become trapped and slowly released or that there is some mechanism by which they are continuously accelerated. For example, Cargill & Priest [1983] suggested a model in which a pair of MHD slow mode shocks trail behind the rising reconnection neutral point. These shocks provide the necessary heating for the post-flare loops.
The reconnection site in these models is frequently linked to the acceleration of super-thermal electrons. In Section 2.3.1, we discuss how recent observations of energetic electron signatures have caused the two ribbon flare model to be revised.

2.2  Accelerated Electron Observations

There are currently no observations that resolve the actual electron acceleration site. This suggests that the fundamental length scales associated with electron acceleration are smaller than the resolutions that are available with current instrumentation. As a result, we must derive information about the acceleration process from observations of accelerated electron populations.
There are two energy loss processes that generate the electromagnetic waves that are used as diagnostics for electrons properties. Electrons collide with material from the chromosphere, which is assumed to be a thick target, so that X-rays are produced by bremsstrahlung at energies comparable to the electron kinetic energy. The second mechanism, gyrosynchrotron emission, produces millimetre and microwaves. X-rays provide a good energy spectrum, but are not indicative of the location of acceleration. Microwaves do not provide good spectral data and coverage, but do give spatial information that is much easier to obtain than for X-rays. Hence millimetre observations can act as a substitute for high resolution X-ray imaging.
Aschwanden [1999] described the events that lead to the production of X-rays in terms of a chain of processes. Although this chapter focuses on the acceleration mechanism for electrons, this is only one process in the chain. After the acceleration of electrons from the thermal population, the injection process allows the accelerated electrons to leave the acceleration region. In cases where the injection process is direct, length and time scales associated with the acceleration process are preserved. A propagation process may then carry the electrons to other parts of the flare. This can mean that X-rays may be detected at a significant distance from the original acceleration region. The trapping process means that electrons can be captured by magnetic mirrors at either end of the flare loop and be stored in this manner. This can lead to the X-ray emission occurring a significant time after the actual acceleration. Finally, the energy loss process is the means by which the energetic electrons lose their energy and provide an observable signature.
The Yohkoh spacecraft [Ogawara et al., 1991], launched in August 1991, is designed to observe solar flares in X and g ray wavelengths. Yohkoh carries two X-ray telescope and one optical telescope that is co-aligned with the Soft X-ray Telescope (SXT), all of which produce full disc images of the Sun. The Hard X-ray Telescope (HXT) [Kosugi et al., 1991] has a temporal resolution of 0.5s, a spatial resolution of about 5 arc sec, and is able to image in four energy bands at 15-24, 24-35, 35-57 and 57-100 keV. Since Hard X-rays are not absorbed by the solar atmosphere above the photosphere, this telescope can produce direct observations of energetic electrons colliding with ions in the photosphere. The SXT [Tsuneta et al., 1991] has a temporal resolution of up to 0.5s, a spatial resolution of about 2.5 arc sec, and an energy range of 0.24-4.0 keV. This instrument is designed to produce movies and also carries a selection of filters to allow images to be made in X-ray spectral lines. Yohkoh also carries two instruments which provide full disc spectra. The Wide Band Spectrometer [Yoshimori et al., 1991] produces high resolution energy spectra over the range 2 keV to 100 MeV using three spectrometers: the SXS, HXS and GRS for Soft-X, Hard-X and Gamma rays respectively. The Bragg Crystal Spectrometer [Culhane et al., 1991] produces emission line spectra and is used for determining element abundances in flare plasma.
A more recent mission, the Transition Region and Coronal Explorer (TRACE) spacecraft [Handy et al., 1999], produces very high resolution images at EUV, UV and visible wavelengths. The TRACE telescope has a smaller field of view than Yohkoh, covering only one-tenth of the solar disc, but has a higher spatial resolution of around 1 arc sec. This design means that the high energy X-ray signatures of electron acceleration are unlikely to be observed, but high resolution images of the structures observed in active regions can be obtained. This is of particular relevance to fragmented energy release models (Section 2.3.2) and direct electric field acceleration mechanisms, some of which require a highly filamented flare structure (Section 2.4.2).
The diagnostics used to produce observations of particles in flares can be split into three broad categories, each of which provides different information about the acceleration mechanism. Spectral information tells us about the particles' energy distribution function. Temporal information gives an indication of the acceleration time scale and power. Statistical information can reveal different classes of flare and the different effects dominant for each species of particle. Any theory of electron acceleration in solar flares must be consistent with observed phenomena. There exists a generally agreed set of observations, discussed below, with which any proposed theory of acceleration must agree [Trottet & Vilmer, 1996,Aschwanden, 1999].

Energies

The electron energy distribution function has a non-thermal power law component, which dominates at energies above around 20 keV and is present because the energetic electrons are produced in collisionless processes, which do not allow the electrons to equilibrate. The spectrum below this energy is a result of bulk plasma heating and is consequently Maxwellian. The power law spectrum for a particle species, s, is characterised by a power law index, ss, according to the equation
Fs(E) µ E-ss
(2.1)
X-ray production via bremsstrahlung produces photons at or below the electron energy. The maximum electron energy can therefore be constrained by the hard X-ray spectrum. Dennis [1988] showed that flares produce relativistic electrons of at least 100 keV. Some flares also produce gamma ray emission up to tens of MeV. In the case of so-called electron dominated flares, there is no evidence for the production of energetic ions which could otherwise produce this kind of radiation [Petrosian et al., 1994]. This indicates that ultra-relativistic electrons with energies of tens of MeV have been produced, although such high energy electrons are not numerous and not, therefore, energetically significant. The power law index for electrons, se, is highly variable when derived from X-ray spectra and can range from 3 to 10 [Dennis, 1988,Dulk et al., 1992].
The energy spectrum of flare accelerated electrons can also be derived from observations of interplanetary electrons at 1 AU. Lin et al. [1981] found that the energy spectrum of the electrons is consistent with a broken power law. Lin et al. [1982] found that for electrons with energies below the break at 100-200 keV the power law index, se, lies between 0.6 and 2.0 and above the kink se lies between 2.4 and 4.3. This suggests that one acceleration process, which bulk accelerates particles to a moderate energy, acts as an injection mechanism for a second mechanism that produces the required relativistic particles [Aschwanden, 1999].
Ramaty et al. [1993] showed that, for a given flare, it is generally true that these interplanetary electrons have a harder spectrum than those derived from X-ray spectra. This could indicate that the second acceleration occurs after the electrons have left the flare. For example, such a mechanism might be an interplanetary shock launched by the flare, as discussed in Section 2.1.2. Ramaty et al. [1993] also suggested that the hardening of the spectrum may simply be a result of high energy electrons escaping from the flare into interplanetary space more easily than less energetic electrons.

Acceleration time

The time taken to transport electrons from the acceleration site to the HXR emission site and associated trapping delays means that it is not simple to calculate the duration of the acceleration process. Higher energy electrons should complete the journey from the acceleration region to the emission site before lower energy electrons. A time of flight study by Aschwanden et al. [1995] described a 10-20 ms gap between two HXR channels of differing energy on the BATSE experiment on the CGRO. They argue that this is consistent with approximately simultaneous acceleration of the electrons to both energies, indicating that the acceleration time from one energy to the other is very short.
It is possible to obtain an upper limit on the acceleration time by looking at the time profiles of HXR emission, which show spikes of short duration. Observations with BATSE at around 100 keV suggest that electrons are accelerated to this energy within 400 ms [Machado et al., 1993], since this was the duration of the HXR spikes. Acceleration to higher energies occurs over longer time scales, suggesting that the more energetic particles interact with the acceleration site for longer periods.
The flare model must, however, account for gradual flares which can continue to produce high energy electrons for hours. This suggests either that electrons are accelerated over the duration of the main phase, either continuously or as a series or bursts, or that they are accelerated in a brief period of time and somehow trapped and stored, slowly leaking out over the course of the main phase.

Production rates

The production rate of energetic electrons is difficult to calculate due to the lack of any direct observational diagnostic. It is, however, possible to make an estimate based on the X-ray bremsstrahlung emission produced by energetic electrons colliding with ions in the chromosphere. Estimates of electron numbers are, however, complicated by the fact that the production of hard X-rays by bremsstrahlung is a very inefficient process in solar flares. X-ray emission accounts for only around 10-5 of the energy in energetic electrons, with the rest of the energy being lost to local plasma heating [Emslie, 1996]. This means that electrons are energetically significant in a flare, despite the fact that the X-rays they produce are not. Although some electrons will escape along open field lines into interplanetary space, Ramaty et al. [1993] observed that the number of electrons escaping is consistently smaller than the number of electrons trapped within the flare, so it is reasonable to use X-ray measures to determine the numbers of energetic electrons.
According to Aschwanden [1999], the total flare energy in energetic ( > 1  MeV) protons can be up to 1023 to 1026  J and in energetic ( > 25  keV) electrons up to 1019 to 1025  J. For a typical impulsive phase duration of 100  s, this leads to a required production rate of up to 1037  s-1 for energetic electrons. The acceleration mechanism must also be capable of producing electrons of up to 100 MeV and protons up to 1 GeV. These relativistic particles are not, however, likely to be energetically significant.
A final point to make is that these production rates provide a less stringent constraint on acceleration mechanisms than the observations of energy spectra and acceleration time. Acceleration times and energies are largely dependent on the acceleration mechanism. The production rates, however, are more likely to be affected by the size and number of acceleration regions. This is more likely to be constrained by the flare model, rather than the details of the physics in the acceleration region.

2.3  Flare Models

The previously described two ribbon flare model has been refined, both by using data from Yohkoh and by introducing new concepts. In this section, we describe how the Yohkoh data have led to improvements in the two ribbon model and discuss the ideas involved in fragmentary energy release. In fact, these two models are not mutually exclusive, as it is possible to stack reconnection sites on top of each other [Spicer, 1977]. Flare top reconnection coupled with a fragmentary model would remove the problems of the high reconnection rates required to explain the observed fluxes of energetic electrons, as well as the related problem of channelling all of the flare energy through a single acceleration region.

2.3.1  Flare top reconnection

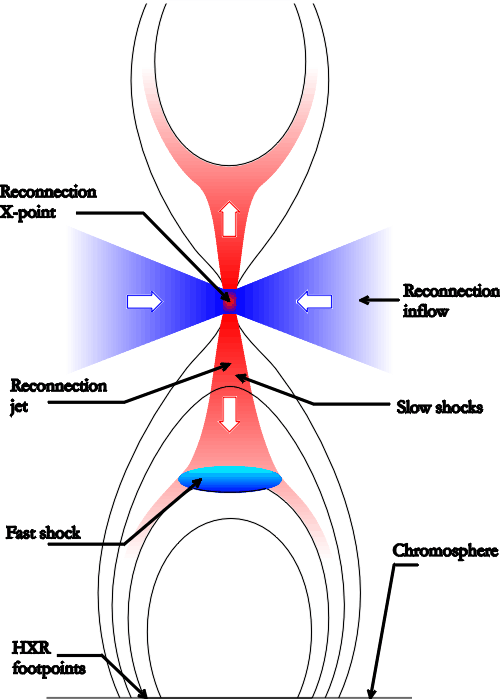
Reconnection was first proposed as a flare mechanism by Gold & Hoyle [1960], who proposed that reconnection occurred between large scale coronal loops. In the two ribbon flare model, however, reconnection is believed to occur at the summit of a flare arcade. In the light of Yohkoh observations, which show 33-53 keV hard X-rays above the soft X-ray flare [Masuda et al., 1995] and a reconnection jet [Shibata et al., 1995], a revised version of the two-ribbon flare model was proposed. In order to achieve reasonable reconnection rates, the reconnection model suggested by Petschek [1964] is used. This implies that slow shocks exist around the reconnection region and gives rise to the version of the two ribbon flare model proposed by Shibata [1995], shown in Figure 2.1.
Direct observations of HXR emission at the top of the flare loop were made by Masuda et al. [1994]. In the Shibata [1995] model, this emission corresponds to the reconnection site. Recently, McKenzie & Hudson [1999] and McKenzie [2000] found that the Yohkoh soft X-ray data provided evidence for falling voids above a flare arcade that are consistent with the reconnection inflow. Yokoyama et al. [2001] was able to measure the velocity of the inflow for a single flare, placing a limit of 5 km  s-1 on the reconnection inflow speed.
The loop-top HXR emission is a signature of non-thermal electron acceleration and could be associated with the existence of shock waves where the reconnection jet collides with the top of the flare loop [Yokoyama & Shibata, 1996,Somov et al., 1999]. At these high energies, electrons are strongly magnetised and stream along the field lines of the arcade until they collide with ions in the photosphere. This results in the electrons losing their energy through bremsstrahlung, which produces the HXR emission seen at the flare foot points. Further evidence that the electron acceleration region is at the top of the flare loop, between the footpoints, comes from electron time of flight observations [Aschwanden et al., 1995].
Reconnection occurs only between the anti-parallel components of the magnetic field on either side of the reconnection site. The flare geometry does not require the reconnecting fields to be anti-parallel, so the fraction of the field that actually reconnects can be significantly smaller than the total magnetic field [Forbes et al., 1989]. Miller et al. [1997] pointed out that, because standard theories of reconnection limit the outflow velocity to the Alfvén speed of the reconnecting field component, the resulting jet will be sub-Alfvénic. Since a flow must be super-Alfvénic with respect to the total field in order to produce a fast-mode shock, they argue that the production of fast shocks is unlikely. The simulations of Yokoyama & Shibata [1996] were, however, able to produce fast mode shocks. This is because, as the jet moves downwards towards the Sun, it encounters lower density and field values, so the local Alfvén speed falls until the jet becomes super-fast with respect to the local plasma.
flarefig
Figure 2.1: The model flare morphology of Shibata [1995] and Yokoyama & Shibata [1996]
This model can be criticised because it explains phenomena that are not seen in all flares. The reconnection inflow has been observed on only a few occasions, double HXR footpoints are not seen in all flares and observations of loop-top HXR emission are relatively uncommon. It is not, however, surprising that there should be significant variation between flares. In particular, the flare model in Figure 2.1 uses a highly idealised geometry. The simulations of Yokoyama & Shibata [1996] showed that the reconnection outflow can produce jets in a variety of directions and that the orientation of the coronal magnetic field will strongly influence the resulting flare geometry. Statistical evidence, however, does point to all flares having very similar physics. It is therefore useful to explain phenomena that are not universally observed, since it is likely that the underlying physics will be common to all flares.

2.3.2  Fragmented energy release

The first evidence suggesting a model of fragmented energy release came from radio observations of flares. During the impulsive phase, each flare is observed to produce of the order of 104 decimetric radio spikes. Benz [1985] proposed that energy release in flares is fragmented, with each decimetric spike corresponding to an individual "microflare", each releasing around 1019  J of energy in around 0.5  s.
Lu & Hamilton [1991] suggested that the coronal magnetic field could be in a self-organised critical state. This would mean that magnetic energy builds up in a large number of small regions. The onset of reconnection in one of these regions, corresponding to a microflare in the Benz [1985] model, would trigger an "avalanche" of explosive reconnection in surrounding regions. The resulting large scale energy release corresponds to a flare.
This idea was developed by Lu et al. [1993] by producing a model that resulted in power law frequency distributions for the energy, peak luminosity and duration distributions of flares. The resulting power law exponents were consistent with their analysis of ISEE3/ICE observations. The power law distributions were observed to exhibit a "roll-off", which corresponds to a constraint on the maximum size of a flare. The measurements of Crosby et al. [1993] and Bromund et al. [1995], discussed in Section 2.1.1, are also consistent with this model. Both papers, however, described a variation in the power law indices through the solar cycle. Crosby et al. [1993] suggested that this could be due to changes in the rate at which the magnetic energy builds up in the reconnection regions.
Avalanche models tend not to be specific about the physics of the electron acceleration process and there is a need to find out more about the detailed physics of such fragmented regions. A variety of mechanisms are plausible, and each of the mechanisms described in Section 2.4 could occur in a fragmented system. Simulations considering particle acceleration by an ensemble of shock waves were run by Anastasiadis & Vlahos [1991] and Anastasiadis & Vlahos [1994]. These simulations considered only shock drift acceleration and ignored interactions between shocks. The simulations produced a good agreement with power law observations and acceleration time scales when the number of shocks was high and there was no additional magnetic mirroring. A similar study was also carried out where the acceleration mechanism was randomly distributed parallel electric fields [Anastasiadis et al., 1997]. These models are primarily statistical, and results are largely independent of the physical model used to produce the electron acceleration. This suggests that the statistical approach may be valid on macroscopic scales, although no further insight can be gained into the microscopic acceleration mechanism.
Anastasiadis & Vlahos [1994] proposed a fragmented energy release model that is able to integrate the energy release and particle acceleration mechanisms. In this model, turbulent motions cause flux tubes to emerge from and withdraw into the photosphere. This generates fragmented flux tubes which form fibres of random radius and twist. Collisions between these fibres produce discontinuous structures and hence current sheets which heat the plasma locally. This intense local heating launches the shock waves which are the basis for the electron acceleration model. Energy release is thus performed by many small-scale localized explosive events, which can act as a catalyst for other events and give rise to an avalanche of energy release. This model also produces the ensemble of shock waves required for their simulations of particle acceleration.
In comparison with the observations in support of a reconnection scenario, the observational evidence supporting fragmentation is less conclusive. The evidence in support of a self-organised critical state is mainly statistical because the scale size of fragmented energy release regions would have to be very small. A fragmented model is also supported by the argument that the high rates of energy transfer into particles are easier to accomplish through more than one acceleration site, since the necessary reconnection rates, currents and field strengths are significantly lower. In addition to the decimetric radio spikes, there is evidence for fragmentation of the reconnection process from TRACE. High resolution EUV images resolve hundreds of fine threads in a flare arcade, each with spatially separated footpoints. This supports the idea that flares are composed of many individual reconnection events [Aschwanden, 1999,Schrijver et al., 1999].

2.4  Acceleration Processes

Although there is debate about whether protons or electrons dominate particle acceleration in solar flares [Cargill, 1996,Simnett, 1996,Emslie, 1996], the biggest challenge is explaining the initial acceleration of electrons to energies at which their gyroradii approach that of thermal protons. This is because the wave fields have more power at longer wavelengths, so the larger gyroradii of protons allow them to couple with the more energetic region of the power spectrum. There is, therefore, argument about whether the initial particle acceleration in a flare is proton or electron dominated. It is generally accepted, however, that relativistic electrons are present, although the mechanism for their acceleration to these energies is not well understood.
We will describe a variety of acceleration mechanisms that have been proposed for electrons in solar flares as reviewed by, for example, Blandford [1994], Miller et al. [1997] and Aschwanden [1999]. Stochastic acceleration relies on second order Fermi acceleration by randomly moving scattering centres. Direct electric field (DC) acceleration involves acceleration by an electric field component parallel to the magnetic field. Acceleration at collisionless shocks can occur in a number of ways and is strongly dependent on the geometry of the shock [Jones & Ellison, 1991]. We will describe the diffusive and shock drift acceleration mechanisms.

2.4.1  Stochastic acceleration

In a stochastic processes, energy is gained in random collisions between particles and an energetic source - in this case, scattering off magnetic structures or waves. Accelerating collisions are more likely than decelerating ones due to the higher relative velocity of head-on collisions between particles and scattering centres compared to collisions in which one catches up with the other [Fermi, 1949]. The rate of energy gain is proportional to (U2/v2) [Priest & Forbes, 2000], where U is the speed of the scattering centres and v is the particle speed, so this is a second order Fermi process.
The waves are coupled to the particles by the resonance condition that relates the cyclotron frequency, W, of the particle to the wave frequency Doppler shifted to the guiding centre frame [Aschwanden, 1999], such that
w- k|| v|| - s W = 0
(2.2)
where w is the wave frequency, k|| is the parallel component of the wavevector and v|| is the parallel component of the particle velocity. The harmonic number s is an integer that determines the type of resonance that operates. Miyamoto [2000] described the strongest resonances, which occur at s = 0 and s = 1. The s = 1 resonance is the cyclotron resonance, in which the particle velocity couples to the work done by the perpendicular component of the wave's electric field over a gyration. At s = 0, two different types of resonance can occur. Landau resonance occurs for a longitudinal wave propagating along the magnetic field. In this case, the wave vector is parallel to the fluctuations in the electric field and the electron drift velocity along the field line couples with the variations in the parallel electric field along the field line. Transit time damping operates if the parallel magnetic field component varies along the magnetic field line, as is the case in a compressional wave mode. In this case, the electron drift velocity is modulated as a result of magnetic moment conservation and the drift velocity therefore couples to the wave.
Particles that are close to satisfying the resonance condition in Equation 2.2 will either gain energy from or lose energy to the wave mode in order to reach resonance with it. If the slope of the energy distribution function is negative at this frequency, the average net energy gain will exceed the net energy loss and the wave mode will be damped, losing energy to the particle population. If the slope of the distribution function is positive, however, the particle population will lose energy and the wave mode will be amplified.
In electron acceleration models for flares the energy source is usually a wave field, represented by a broadband wave spectrum N(k). Such a wave field can provide a range of resonances, so an electron can continue to either gain or lose energy as it resonates with waves at progressively higher or lower frequencies. The fact that an electron can either gain or lose energy means that the acceleration is stochastic in nature, with the slope of the energy distribution function determining whether the population gains or loses energy on average. Stochastic acceleration by a wave field that can provide resonance at a range of frequencies is therefore a good method for accelerating electrons in the tail of an energy distribution to higher energies.
The impulsive phase of a flare results in a large scale reconfiguration of the magnetic field. This is equivalent to introducing a very large amplitude, small k wave. In a turbulent medium, wave power is distributed over all spatial scales. This energy at small k can therefore cascade to higher wavenumbers, resulting in a power law wave spectrum over a large range of k. For this reason, turbulence is often invoked in stochastic acceleration theories in order to provide a wave spectrum that covers the necessary range of frequencies. In hydrodynamics, a simple turbulent fluid will have a Kolmogorov spectrum:
N(k) µ k-5/3
(2.3)
Complications such as the introduction of a magnetic field, which results in the loss of a degree of freedom, mean that wave modes in a turbulent plasma might not necessarily have a Kolmogorov wave spectrum. Miller & Ramaty [1987], for example, used a wave spectrum with a power law exponent of -5/3 for Alfvén turbulence, but an exponent of -7/3 for whistler turbulence. In comparison, Salem [2000] found that the solar wind, which is commonly used as an example of a relaxed turbulent plasma, has Alfvén turbulence with a power law exponent of -5/3, whilst the whistler turbulence has a power law exponent of -3.
The interaction of particles with waves is complicated, since the coupling mechanism is a resonant interaction between the electrons and a wave field. It is, therefore, difficult to write down an equation describing the evolution of electrons through phase space. Some wave modes couple with a particular particle species better than others, so there are different types of stochastic acceleration, depending predominantly on the momentum source [Benz, 1996]. By understanding the nature of the resonance between a given wave mode and a particle at a given energy, however, it is possible to predict the regimes in which stochastic acceleration will be effective. Since this is a qualitative discussion, we will follow Miller et al. [1997] in not considering the slope of the power law turbulent wave spectrum, N(k).
wave_modes
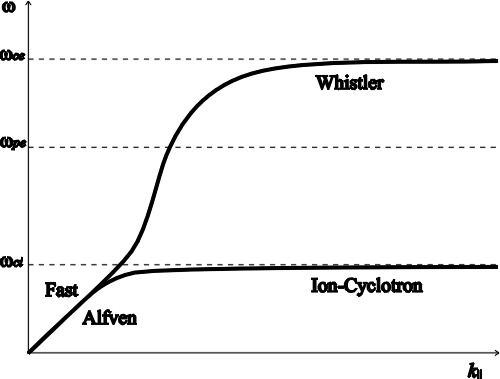
Figure 2.2: The dominant plasma wave modes propagating parallel to the magnetic field in a cold hydrogen plasma. The w axis is labelled with the ion cyclotron (wci), electron cyclotron (wce) and electron plasma (wpe) frequencies.
At small k, kinetic mode properties deviate from fluid counterparts when b >~0.5 [Krauss-Varban et al., 1994]. Since in solar flares b ~ 0.01-0.1, it is reasonable to assume that the wave field will be dominated by cold plasma modes and that the kinetic modes are not significant. The dispersion relation relating to parallel propagation for the dominant wave modes in a cold hydrogen plasma are shown in Figure 2.2. Both the Alfvén/ion cyclotron and whistler branches relate to waves with a parallel electric field component, so electrons can be accelerated by the cyclotron resonance.
Alfvén waves propagate when w < wci and have a dispersion relation
w = vA k||
(2.4)
Substituting this into the resonance condition (Equation 2.2) with s = 1 gives the constraint that, for an electron to resonate with an Alfvén waves,
v|| £  mp

me
vA
(2.5)
Whistler waves, which propagate at frequencies wci << w << wce, have a dispersion relation
w =  We c2 k2 |cosq|

wpe2
(2.6)
and electrons are able to resonate only when
v|| << æ
è
 mp

me
ö
ø
1/2

 
vA
(2.7)
Using the value of vA = 2000  km  s-1 suggested by Miller et al. [1997], this provides a threshold acceleration energy around 6 MeV for Alfvén waves and 20 keV for whistler waves. Although whistler waves are unable to accelerate electrons from thermal energies, Miller & Ramaty [1987] suggested that whistlers could accelerate a "seed" population of electrons with energies above 10 keV to produce the energetic electrons with energies above 20 keV that are necessary to produce the observed X-ray emission. These energetic electrons would themselves act as a seed population for resonance with the Alfvén waves, which could produce the observed small population of ultrarelativistic electrons.
Steinacker & Miller [1992] found that whistler waves could be used to accelerate electrons out of the thermal population if the w << wce condition was relaxed. They also find that whistler acceleration can operate on sufficiently short time scales to be consistent with observations as long as whistler turbulence accounts for around a tenth of the total energy in the magnetic field. An additional mechanism for accelerating electrons from the thermal population was proposed by Miller et al. [1996] using the previously discussed long wavelength structures that result from large scale reconfiguration of the magnetic field. These small k fast mode waves couple to the electrons through transit time damping, with s = 0. This model was able to produce sufficient quantities of electrons above 20 keV, as well as producing MeV electrons on time scales of a few seconds. The resulting electron energy spectrum was very hard, however, with a power law index of 1.2, although the authors suggest that electron escape might soften the spectrum.
Simulations of ion acceleration by Alfvén waves by Kuramitsu & Hada [2000] showed how the amount of energisation can be affected both by the presence of coherence between the waves and by the strength of the waves, particularly as the Alfvén waves become non-linear. They used the standard description of stochastic acceleration as a diffusion in momentum space. The effect of phase coherence is reasonably constant with wave strength and can increase the diffusion coefficient by up to a factor of 2. As the amplitude of the waves increases above 0.1 times the background field strength, however, the increase in the diffusion coefficient as a result of the non-linearity of the waves reaches a factor of 2 and begins to dominate. In other words, the properties of the accelerated particle distribution are very heavily dependent on a number of properties of the wave field, such as the amplitude, phase, direction and frequency spectrum. The suggests that the acceleration mechanisms described here may not be robust to the strong assumptions made about the properties of the wave fields. This is particularly significant because of the lack of observations regarding the level of MHD turbulence in flares.

2.4.2  Direct electric field (DC) acceleration

Direct electric field acceleration arises when electrons are accelerated by a DC (i.e. quasi-static) electric field component parallel to the magnetic field. Under the assumptions of ideal MHD, it is not possible for the U ×B electric field to have any parallel component. DC acceleration only occurs when the frozen-in flux theorem breaks down. The conditions required for this to happen can be obtained by looking at the generalised Ohm's law for a homogeneous plasma:
E = - U ×B + hJ +  1

n e
J×B -  1

n e
Ñ·Pe +  me

n e2
 J

t
(2.8)
where Pe is the electron pressure tensor. In addition to the U ×B term from ideal MHD, the J×B Hall term is also unable to produce a parallel electric field component. The hJ resistive term, however, is able to produce a parallel electric field in regions, such as reconnection sites and current sheets, where resistivity may become significant. This resistivity may be due either to particle-particle interactions (classical) or wave-particle interactions (anomalous). A parallel electric field can also be generated in regions, such as neutral sheets and discontinuities, where there are large gradients or rapid variations in the plasma. The parallel component arises from the terms in the generalised Ohm's law containing the anisotropic electron pressure and the time variation of the current.
These parallel components of the electric field allow electrons to freely accelerate along fields lines. This process is limited by the Coulomb drag force felt by the accelerating population, which results from collisions with particles in the thermal ion distribution [Dreicer, 1960]. If the mean free path of an electron is small, electron-ion collisions will reduce the current until it saturates at some critical velocity, which depends on the electric field:
jcr=-e n0 vcr
(2.9)
When the electron's speed is very large, the mean free path is long enough that some "run-away" part of the electron distribution function can be freely accelerated by overcoming these scattering events. The interval between interactions is the electron-ion collision frequency:
fei=n0 sc áve ñ
(2.10)
where sc is the collisional cross-section. If we take the Spitzer collision frequency as an example, which assumes Coulomb collisions with a cut-off at the Debye length,
sc =  wpe4

16 pn02 ve4
(2.11)
we can see that the collisional coupling between ion and electrons decreases with particle speed. Now, assuming elastic collisions, the electron equation of motion is
me  d ve

d t
= -eE - fei me ve
(2.12)
Hence there is a critical field at which the rate of change of the electron velocity disappears for a thermal electron with velocity áve ñ. This is the field strength above which an electron initially moving at the thermal speed will gain energy indefinitely and is known as the Dreicer field, ED:
ED =  me fei áve ñ

e
(2.13)

=  me n0 sc áve ñ2

e
(2.14)
The classification of DC acceleration theories as sub-Dreicer or super-Dreicer is important, since sub-Dreicer models are limited by collisional processes, whereas super-Dreicer models can produce run-away electron acceleration and the maximum energy to which electrons are accelerated is specified by the properties of the acceleration region, rather than being intrinsic to the acceleration process. We will now describe an example model from each of these two categories.
One example of a model using super-Dreicer DC acceleration is in the current sheet associated with a reconnection region. Super-Dreicer acceleration models have been proposed for accelerating electrons in a reconnecting current sheet. Holman et al. [1989] proposed an electron run-away model that allows electrons to be accelerated through the entire current sheet before leaving it. This model was used by Zarro et al. [1995] to calculate an electric field using SXR and HXR observations of a solar flare. They found the electric field during the impulsive phase to be around 10-4  V cm-1. This is surprisingly small, and is of a similar size to the Dreicer field [Miller et al., 1997].
Litvinenko [1996] found that it was not, in fact, reasonable to assume that an electron would be accelerated through the entire length of the current sheet. Electrons are ejected from the sheet after much shorter interaction lengths as a result of their E×B drift. Taking this into account, Litvinenko [1996] calculated that the interaction length is reduced by around five orders of magnitude and that an electric field of around 10  V cm-1 is required. This field is clearly super-Dreicer and it is claimed that the factor of five difference in the interaction length explains the discrepancy between this field value and the one determined by Zarro et al. [1995].
A sub-Dreicer acceleration model has been proposed to produce acceleration in a large number of current channels. Holman [1985] found that the classical resistivity in a current channel could be used to accelerate electrons with a sub-Dreicer electric field in solar flares. As the field is always sub-Dreicer, the acceleration of thermal electrons is collision-limited and only the electrons in the high energy tail of the distribution function will experience run-away acceleration to high energies. Emslie & Hénoux [1995] argue that it is not possible for a single current channel to carry sufficient current to produce the required number of energetic electrons. Holman [1985] showed that at least 104 current channels would be required. In this model, the current channels need to be oppositely directed in order to provide a path for the return current. Emslie & Hénoux [1995], however, suggested that the return current could be provided by a drift of protons in a layer within the chromosphere.
Benka & Holman [1994] pointed out that current channels directed along the flare loop can produce the observed HXR emission at the foot points. They found that such a scenario was consistent with both a fragmented energy release model and with flare observations. Observational evidence for the required filamentation may be seen in recent TRACE observations [Schrijver et al., 1999].

2.4.3  Shock acceleration

Acceleration at shocks has traditionally been divided into two processes that depend strongly on the shock geometry. Diffusive shock acceleration is a first order Fermi mechanism that is dominant near quasi-parallel shocks. Quasi-perpendicular shocks, on the other hand, are favourable to shock drift acceleration. We will describe below simple models for these processes. In Chapter 5, however, we will show how electrons may be accelerated by a form of diffusive acceleration that operates in the structure found within quasi-perpendicular shocks.

Shock drift acceleration

Shock drift acceleration dominates over diffusive processes in a quasi-perpendicular shock because the geometry of the magnetic fields does not allow particles to transit freely through the shock. Particles are instead accelerated by the motional electric field (-V×B) as the gradient drift, which is proportional to B ×ÑB, causes them to move along the electric field within the shock transition. We will see that large energy gains can be produced if the particles can be reflected at the shock transition. This reflection is a fast Fermi process, since the acceleration happens in a single reflection at the shock front.
If we assume that the shock structure is stationary, one-dimensional and that the electron gyroradius is much smaller than the shock thickness, then electrons will conserve their magnetic moment, m. They will therefore experience a mirror force due to the increase in magnetic field at the shock front and some of the electrons will be reflected. Reflection for ions differs from the electron mechanism because we can no longer assume that the gyroradius is small compared to the shock thickness. This means that individual ions do not conserve their magnetic moment upon reflection, so their behaviour is not adiabatic. Empirical results from test particle simulations, however, suggest that ion magnetic moment is conserved on average, so the resulting acceleration is similar to the electron case.
The various reference frames relevant to shock physics are discussed in Section 1.4.2. We will denote quantities in each of these frames using a subscript and unit vectors with a hat. Adiabatic electron acceleration theory is most easily studied by working in the de Hoffman-Teller frame [Leroy & Mangeney, 1984,Wu, 1984]. This means that the motional electric field is zero, so no energy is gained from the shock drift. If the structure of the shock is stationary, we can therefore consider an electron to conserve its energy. This results in acceleration in the initial plasma frame when the electron's velocity is transformed back after interacting with the shock, which can be attributed to the particle's motion along the motional electric field. Adiabatic acceleration is therefore a shock drift process.
HT_transform_vels
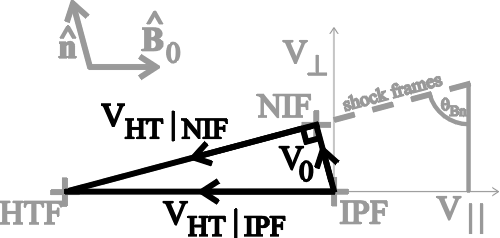
Figure 2.3: Velocity diagram in (v||, v^) showing the velocities acquired by the transfer to the de Hoffman-Teller frame from the initial plasma frame (IPF) and normal incidence frame (NIF). The dashed line indicates the set of shock frames and all velocities are assumed to be in the coplanarity plane.
The velocities between the de Hoffman-Teller frame and various other frames are shown in Figure 2.3. The velocity acquired by the transfer to the de Hoffman-Teller frame from the normal incidence frame is
VHT|NIF=
^
n
 
×(V0×B0)

B0·
^
n
 
(2.15)
In fact, this is true for any shock frame if V0 is replaced by the upstream flow velocity in that frame. Figure 2.3 shows that the de Hoffman-Teller velocity in the initial plasma frame is equal to the component of VHT|NIF that lies along B0, so
VHT|IPF = VHT|NIF ·
^
B
 

0 
= -  V0 sin2qBn

cosqBn
^
B
 

0 
(2.16)
The transition from upstream of the shock to the overshoot represents a large increase in the magnetic field felt by an electron, which provides the possibility of significant magnetic reflection. The fraction of electrons that are reflected is determined by the value of the maximum magnetic field, B1. We can transform the components, perpendicular and parallel to B0, of an electron's velocity in the upstream plasma rest frame, v:
v|||HTF=v|| - VHT ·
^
B
 

0 
(2.17)

v^|HTF=v^
(2.18)
Reflection will occur if and only if the electron cannot conserve its magnetic moment while crossing the shock. If the potential difference between the upstream and the overshoot is f0, then the condition for reflection is:
m ³
e f0|HTF+  1

2
m v2 |HTF

B1
(2.19)
The velocity components in the reflected distribution transform as:
v||r = -v|| + 2 VHT ·
^
B
 

0 
(2.20)

v^r=v^
(2.21)
Since VHT ·[^(B)]0 is a negative quantity, this leads to an acceleration of the electron population. A discussion of how adiabatic theory can be applied to predict energy spectra for our simulations is presented in Lowe & Burgess [1999b] and Section 5.1.1.
As discussed in Section 5.1.2, it is accepted that shock drift acceleration is significant at the Earth's bow shock. The fact that large energy gains can only be produced over a small range of the angle qBn [Leroy & Mangeney, 1984], however, led Melrose [1994] to claim that there is no evidence that shock drift acceleration is significant in flares. As discussed in Section 2.3.2, some models of fragmented energy release employ a shock drift mechanism in an ensemble of shocks. By passing through multiple shocks, such models can then lead to significant energy gains. We will discuss in this thesis how deviations from the simplified analysis given above can lead to additional electron acceleration in a single shock that might be significant in the context of flares.

Diffusive acceleration

Diffusive acceleration occurs when scattering centres in the region of the shock cause pitch angle scattering of charged particles. This can cause particles to be reflected back towards the shock many times. Since the upstream and downstream scattering happens in different local plasma rest frames, this results in a net gain of energy on each transit that depends on the flow speed change at the shock. This mechanism depends of the free movement of particles through the shock front, so we might expect it significantly less effective when the shock is quasi-perpendicular. For this reason, diffusive acceleration is most commonly discussed in the context of quasi-parallel shocks.
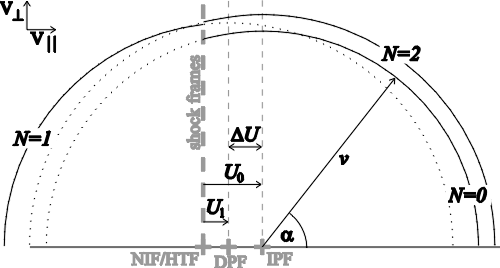
In order to examine the momentum change across the shock transition, we will use a simplified analysis in which we assume a parallel shock geometry with the flow parallel to the shock normal. In this geometry, the de Hoffman-Teller frame and the normal incidence frame coincide. A diagram of diffusive acceleration in this geometry is shown in Figure 2.4. The diagram shows the relevant velocities in (v||,v^) space, where the upstream flow velocity in the NIF is U0 and the downstream flow velocity is U1. We will assume that scattering centres travel at the local plasma velocity and that they make the distribution isotropic upstream and downstream of the shock, but not in the shock transition. We assume that energy is conserved during the shock transition and that shock drift acceleration is negligible. We also assume that the initial particle velocity v is much greater than the flow velocities, so that v >> U0 > U1. Finally, we assume that the velocities are non-relativistic.
diffusive_acceln
Figure 2.4: Velocity space diagram showing velocities relevant to diffusive acceleration in a parallel shock. The upstream initial plasma frame (IPF), downstream plasma frame (DPF) and normal incidence/de Hoffman-Teller frame (NIF/HTF) are shown in grey. Particle distributions at the average energy are shown in black, labelled by the number of passes through the shock, N. The solid lines represent the part of the distribution that will travel back through the shock, whilst the dotted lines represent the particles that will escape from the shock.
We shall express electron velocity components in terms of the pitch angle, a, in the plasma rest frame before the shock transition:
v^=vsina
(2.22)

v||=vcosa
(2.23)
If we use an isotropic distribution function,
f(a) da µ sina da
(2.24)
Since we are neglecting shock drift acceleration, the only change in velocity comes as a result of the frame transformation, so that the velocity distribution is no longer centred on the origin in velocity space. The frame transformation involves adding a velocity DU to the v|| component, so
v2(a) = vsin2 a+ (vcosa+ DU)2
(2.25)
Only particles heading towards the shock in the HTF will pass through the shock. If, for a given v, particles with pitch angles between a1 and a2 pass through the shock, the average energy per particle after the shock transition becomes
áE ñ =  1

2
m ó
õ
a2

a1 
f(a) v2(a) da/ ó
õ
a2

a1 
f(a) da
(2.26)
Let us consider the transition from upstream to downstream, so that DU = U0 - U1. This corresponds to the transition from N=0 to N=1 in Figure 2.4.
áE ñ =  1

2
m æ
è
v2 + DU2 +  v (U0 - U1)

2
 cos2a1 - cos2a2

cosa1 - cosa2
ö
ø
(2.27)
If v >> U0, we can make the approximation that only the particles with v|| > 0 will pass downstream through the shock, so that a1 = 90° and a2 = 180°. The mean momentum change per particle is therefore
ádp ñ =  1

2
æ
è
 p

v
ö
ø
DU
(2.28)
so this is a first order process. In the case of the transition from downstream to upstream, U0 and U1 are interchanged in Equation 2.26. This corresponds to the transition from N=1 to N=2 in Figure 2.4. Under the approximation that v >> U0 > U1, however, only particles with v|| < 0 will pass back upstream through the shock, so that a1 = 0° and a2 = 90°. This means that Equation 2.27 is valid for transitions in both directions. In terms of Figure 2.4, the acceleration process then continues as before, with the N=2 to N=3 transition being equivalent to the N=0 to N=1 transition in the diagram.
We will follow the method described by Jones & Ellison [1991] to find the momentum distribution of particles leaving a diffusive shock. In order to find the momentum change for a single shock transition, they used a more rigorous approach, assuming that scattering keeps the particle distribution isotropic throughout the shock transition and including shock drift acceleration. They found that
ádp ñ =  2

3
æ
è
 p

v
ö
ø
DU
(2.29)
This means that, if a particle with initial momentum p0 traverses the shock N times, its average momentum will be
áp ñ(N) = N
Õ
i=1 
é
ë
1+  2

3
 DU

vi
ù
û
p0
(2.30)
Consider particles with speed v in the downstream frame, with a velocity component in the shock normal direction vx. Since the shock is moving in the negative x direction with speed U1, particles with vx < -U1 can pass back upstream. The upstream flux is therefore
ê
ê
ó
õ
-U1

-v 
(U1+vx)dvx ê
ê
=  1

2
(U1-v)2
(2.31)
If we then approximate the flux crossing from upstream to downstream to be the remainder of this distribution, so that
ê
ê
ó
õ
v

-U1 
(U1+vx)dvx ê
ê
=  1

2
(U1+v)2
(2.32)
then the probability of return is the ratio of these two fluxes. If we assume that all particles upstream of the shock will eventually return downstream, the particle will traverse the shock N times if it has returned from downstream at least N/2 times. The probability that Nesc, the number of times that the particle cross the shock before finally escaping, exceeds some value N is therefore
P(Nesc ³ N) = N/2
Õ
i=1 
æ
è
 1-U1/vi

1+U1/vi
ö
ø
2

 
(2.33)
This imposes a constraint on diffusive acceleration, since no particles can return downstream if U1 £ vi. In fact, in order to continue this analysis, we will take only first order terms in U1/vi, so we need to make the approximation that v >> U0 > U1. This means that the diffusive acceleration process can require particles to have a considerable initial injection energy.
By taking the logarithm of Equation 2.32 and expanding to first order in U1/vi, we find
lnP(Nesc ³ N) » -4 U1 N/2
å
i=1 
 1

vi
(2.34)
Also, taking the logarithm of Equation 2.29 and using only the first order term,
ln é
ë
 áp ñ(N)

p0
ù
û
»  4

3
DU N/2
å
i=1 
 1

vi
(2.35)
In order to determine the momentum distribution of the particles, we need to combine these equations to eliminate vi. Strictly speaking, the two equations use velocities vi measured in different frames. However, since we are assuming that v >> U0 > U1, they are equal to first order in u/v, so the probability that a particle escapes with a momentum of at least p is
P(pesc ³ p) » æ
è
 p

p0
ö
ø
-3U1/DU

 
(2.36)
Diffusive acceleration therefore produces a particle distribution function with the form of a power law. The acceleration process is first order Fermi, so it is fast and efficient.
A much more significant constraint for electron acceleration, however, is the assumption that the scattering centres on either side of the shock are able to produce an isotropic distribution. Although the low frequency waves produced in the shock transition are generally effective at scattering ions, this is not necessarily true for thermal electrons. This is equivalent to the difficulty discussed in Section 2.4.1 of stochastic processes being unable to raise electrons to a sufficiently large energy that they can resonate with the Alfvén wave field. The diffusive acceleration process therefore has an injection problem and requires electrons to have a considerable initial injection energy of as high as 6 MeV.
Diffusive acceleration has been used in a model of electron acceleration in flares by Tsuneta & Naito [1998]. They suggested that slow shocks attached to the reconnection site could heat electrons to above the injection energy required for diffusive acceleration to occur in the thermal population. A further benefit of the slow shocks in this model is that they trap electrons between the reconnection site and the fast shock, ensuring that the electrons stay at the acceleration site. This heating by slow shocks is not, however, consistent with the lack of observations of energetic electrons near slow shocks in the Earth's geomagnetic tail.
A first order mechanism is the most efficient way of accelerating electrons at a shock, so many attempts have been made to find a model in which this can be achieved. Any magnetic obstacle upstream of a parallel shock will propagate towards the shock in the shock frame. Gisler & Lemons [1990] described how electrons may then be caught in the collapsing trap formed by the intersection of a magnetic loop with the shock front, resulting in first order acceleration. This mechanism is discussed further in Section 5.1.2.
Somov & Kosugi [1997] suggested a variation of this model in solar flares. They suggested that loops of magnetic field could be generated at a turbulent reconnection current sheet. As this loop passes through a fast shock below the reconnection site, electrons are accelerated by two first order Fermi mechanisms. In addition to acceleration by the collapse of the magnetic trap, electrons are also accelerated by diffusive acceleration at the shock front.

2.5  Comparison with Earth's bow shock

Flare plasma parameters are difficult to establish observationally because observations focus on energetic phenomena, which are not representative of the bulk plasma. In the corona, the magnetic field is too weak to allow measurements by observations of Zeeman splitting. The best estimates of these quantities often come from parameter fitting in simulations. For this purpose, we take the results of Yokoyama & Shibata [1996], who used an MHD model to attempt an explanation of flare behaviour in which a reconnection jet interacts with the flare arcade. Their simulations use a coronal plasma which is denser and cooler than is realistic, which leads to some difficulty in converting their normalised units. They take two approaches to this. The first approach is to make a direct conversion relative to plasma parameters in the photosphere. The second approach is to compensate for the revised coronal parameters and to make the conversion using revised coronal plasma parameters. Since these simulations produce fast shocks that are located between the reconnection jet and the flare arcade, they are much more closely related to the corona than to the photosphere, so we use the coronal normalisation to estimate the properties of the upstream plasma. Although these parameters are consistent with each other, estimates of them can vary widely. For example, the prediction of the Alfvén speed by Yokoyama & Shibata [1996] is consistent with that of Zirin [1988], but is an order of magnitude lower than other estimates by Miller et al. [1997] and Tandberg-Hanssen & Emslie [1988].
bow_foreshock
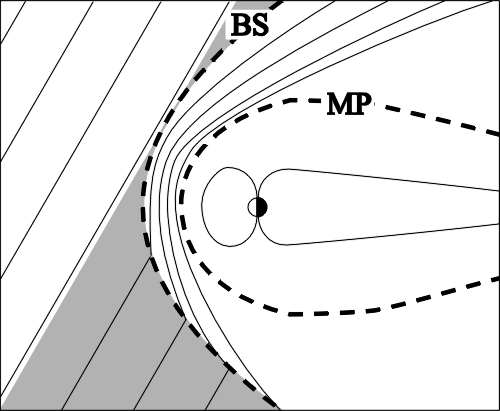
Figure 2.5: The magnetic topology of the solar wind's interaction with the Earth's bow shock (BS) and magnetopause (MP). The electron foreshock is shaded grey.
The Earth's bow shock is formed by the interaction of the solar wind with the Earth's magnetic field, as shown in Figure 2.5. It is a well observed example of a collisionless shock that serves as an excellent laboratory for the study of acceleration processes. In contrast to flare shocks, the properties of the Earth's bow shock can be measured by spacecraft in situ and are therefore well established. Table 2.2 compares the properties of a solar flare fast shock, as derived from Yokoyama & Shibata [1996], with the properties of the bow shock. The values of the upstream plasma parameters at the bow shock are assumed to be identical to the solar wind at 1 AU, as described by Hundhausen [1995]. The properties of the shock itself are taken from Burgess [1995].
Parameter Flare shock Bow shock
MA 1.0-1.6 4-10
qBn unknown depends on position
Rc unknown » 15  RE
vA 160 km  s-1 40 km  s-1
vA Wi-1 10  m 80  km
b 0.01 - 0.1 1.6
B 130 - 190  mT 7  nT
Te 300  eV 10 - 60  eV
Table 2.2: A comparison of the approximate values of bulk plasma parameters upstream of the Earth's bow shock [Burgess, 1995,Hundhausen, 1995] and a solar flare fast shock [Yokoyama & Shibata, 1996].
The Earth's bow shock is curved, with a radius of curvature at the point nearest the Earth of Rc » 14 RE , so that the angle qBn varies along the length of the shock. This curvature also means that the electron foreshock is very large, consisting of the field lines in the solar wind that are downstream of the point of tangency, as shown in Figure 2.5. Fitzenreiter [1995] reviewed the observations of electrons in the foreshock streaming away from the bow shock. The most energetic electrons occur in a thin sheet that is connected to the perpendicular bow shock. This suggests that the most energetic electrons originate from near the point of tangency. The curvature of the shock has been used to explain this effect, as discussed in Section 5.1. These mechanisms do not, however, explain observations of energetic electrons downstream of the bow shock. Gosling et al. [1989] found a population of electrons downstream of the shock at significantly higher energies than can be produced by simple application of adiabatic theory. They show electron data from an example shock crossing with a power law distribution of velocities taking the form:
f(v) ~ E-3.7
(2.37)
This demonstrates that the bow shock accelerates electrons to high energies with a power law spectrum in a manner consistent with the required acceleration mechanisms in solar flares. These observations are studied in more detail in Chapter 5.
In the case of solar flares, it is possible that the initial population of electrons undergoes some form of acceleration prior to injection into the shock. This could occur, for example, at the reconnection site. We have assumed no such pre-acceleration and have derived an initial electron energy, Einit » 300 eV, simply by considering a thermal electron at a typical coronal temperature of around 2×10⁶ K. In the case of Earth's bow shock, the upstream electron energy is determined by parameters in the solar wind at 1 AU. The electron distribution can be approximated by a core population of electrons at 10 eV combined with a halo population at 60 eV [Wu, 1984,Feldman et al., 1975].
Although the plasma environment at the Earth's bow shock differs considerably from that in solar flares in many respects, the bow shock has a number of similarities with the proposed solar flare electron acceleration mechanisms involving shocks. Both shocks have a similar Alfvén Mach number and both are fast mode shocks. The Alfvén speed in the two regimes is very different, but this matters only in the relativistic transition and, in fact, a higher Alfvén speed makes the problem of accelerating electrons easier. This is because the higher relativistic mass produces a corresponding increase in the electron gyroradius, so the electrons have a larger interaction cross section with the acceleration region. Whilst the electron injection energy is known at the Earth's bow shock, but not in the solar flare model, it is the acceleration of electrons to relativistic energies that is poorly understood in both cases. The key difference between the two cases is the significantly higher temperatures and Alfvén speed in the solar corona. This will make relativistic effects more significant and consequently make the acceleration of electrons easier. An initial study is made of these differences in Section 6.3.

2.6  Summary

The production of large quantities of energetic electrons in solar flares is an open problem. The fact that the acceleration region cannot be resolved by current observations means that the details of the acceleration mechanism remain unclear. We describe some of the mechanisms that have been suggested and argue that the explosive nature of flares means that the production of shocks is likely to be in the context of a reconnection model. There is also evidence to suggest that flares are fragmentary in nature, in which case an ensemble of shocks may be present.
Measurements of the plasma and particle environments in the region of flare shocks are not currently possible. The Earth's bow shock is, however, well studied. We argue that the electron acceleration processes at the bow shock could be similar in nature to those in flare shocks. In particular, understanding the observations of downstream electrons with power law energy spectra at the bow shock may provide us with a better understanding of the acceleration process for electrons in solar flares.


Page Maintained By : Rob Lowe
Last Revision : 1st March 2003