Chapter 4
Shock Surface Ripples

This chapter presents our study of ion scale ripples, which are seen to move along the shock front in two-dimensional hybrid simulations [Winske & Quest, 1988]. We simulate these ripples using a pre-existing hybrid code, which was written by Matthews [1994] and subsequently parallelised by Woodcock [1997]. In our simulations, ripples are seen to move along the ramp and overshoot. They are most clearly visible in the shock normal component of the magnetic field, Bx; a strictly one dimensional shock would have a constant normal magnetic field component. The process that generates the ripples remains poorly understood because high field gradients at the overshoot cause difficulty in identifying instabilities there. One possible mechanism is an instability driven by reflected ions gyrating back into the shock [McKean et al., 1995]. Ripples could also be caused by wave trapping at the front due to the variation of the Alfvén speed through the shock ramp and overshoot, and we argue that ripples at the shock front are formed by the excitation of a surface wave mode.

4.1  Previous Work

Winske & Quest [1988] used a 2-D hybrid simulation to examine the relaxation of the highly anisotropic ion distribution that is produced at a quasi-perpendicular shock front as a result of ion reflection. They found that low frequency waves were produced behind the shock front that could be understood in terms of linear theory when applied to the Alfvén Ion-Cyclotron instability. McKean et al. [1995] also used a 2-D hybrid code to show that the Alfvén Ion-Cyclotron and mirror mode activity that is observed in the Earth's magnetosheath is generated near the bow shock and convected away. They found that wave activity peaks at the shock front and then falls by an order of magnitude within several ion inertial lengths (vA Wi-1) of the shock.
At the shock ramp, however, Winske & Quest [1988] found that measured wavelengths were not consistent with linear theory. They found that "ripples", in the form of large magnetic field and density oscillations propagate parallel to the magnetic field in the shock ramp. Indirect observational evidence for these ripples comes from measurements of whistler waves propagating upstream of planetary shocks in the "out-of-coplanarity" direction [Fairfield, 1974,Orlowski & Russell, 1991,Orlowski et al., 1995]. Hellinger et al. [1996] and Hellinger & Mangeney [1997] used a 3-D hybrid code to show that "out-of-coplanarity" upstream whistlers are produced at the shock ramp. Their simulations also produced rippling at the shock front and it appears that these upstream whistlers are generated by the shock front rippling.
There are a number of processes that are candidates for the generation of ripples. Winske & Quest [1988] suggested that the shock ripples are driven in a non-linear fashion by the Alfvén Ion-Cyclotron instability. By comparing with simulation results, they found that linear theory provides a good description of the plasma downstream of the shock. Their attempt to describe the structure at the shock front was, however, unsuccessful. This was not surprising, since the assumption of local homogeneity is not applicable in the high field gradients and the dynamics of the shock front are likely to be non-linear.
Hellinger et al. [1996] found that, for an inflow speed into the simulation box of 2 vA, they generated a slightly supercritical shock with MA=3.3. In this case, the Alfvén Ion-Cyclotron mode was not excited, but upstream whistlers were still generated. Hellinger & Mangeney [1997] found that ripples were not generated at these slightly supercritical shocks. Hellinger et al. [1996] and Hellinger & Mangeney [1997] suggested that a more likely mechanism for ripple generation is the gyrating gyrotropic proton beam instability [Wong & Goldstein, 1988], which involves reflected ions gyrating back into the shock. We present evidence to suggest that ripples could be caused by wave trapping at the front due to the variation of the Alfvén speed through the shock ramp and overshoot.

4.2  Simulation Configuration

Our simulation of the shock fields uses the CAM-CL hybrid code discussed in Chapter 3 and implemented by Matthews [1994] and Woodcock [1997]. This models the plasma in a self-consistent manner as ion macroparticles and an inertialess electron fluid. Our simulations are 2-D in space and 3-D in velocity. The choice of a hybrid code means that electron physics is not well modelled, so it is possible that, in reality, accelerated electrons might damp the ripples. Our hybrid simulation is also unable to model electron scale turbulence and electron scale ripples, which are seen in full particle PIC codes and may affect the dynamics. Micro-turbulence associated with currents along the shock, for example, could alter the growth and structure of the ion scale ripples. Whilst electron inertial scales could be included by using a full particle code, the time and length scales associated with ion scale rippling are generally too long to be modelled in this way.
shk_geom
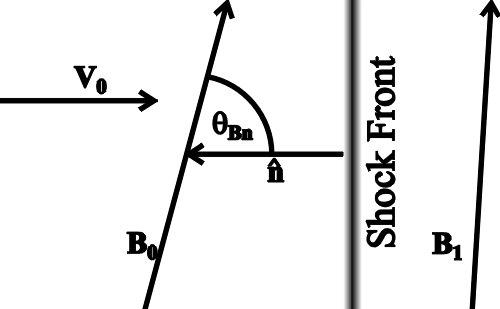
Figure 4.1: The geometry of a collisionless shock, as used in our simulations and discussion of electron acceleration mechanisms. The magnetic field B, inflow velocity V0 and shock normal [^(n)] are co-planar. In this geometry, the reference frame is such that V0 and [^(n)] are anti-parallel.
We generate a shock by reflecting homogeneous plasma moving at constant velocity off a stationary, perfectly conducting barrier, which provides a clean shock once the shock front is clear of the reflecting barrier. The plasma flows in from the left hand x boundary and reflects at the right hand x boundary. The y boundary conditions are periodic. The simulation geometry is shown in Figure 4.1 and the standard parameters for our simulations are shown in Table 4.1.
Parameter Symbol Value
cell size in x Dx 0.2 vA Wi-1
cell size in y Dy 0.2 vA Wi-1
time step Dt 0.01 Wi-1
number of cells in x nx 360
number of cells in y ny 128
number of time stepsnt 4000
electron plasma beta be 0.5
perpendicular ion temperature Ti^ 0.5
parallel ion temperature Ti|| 0.5
number of field substeps ns 10
number of ions per cell 50
Table 4.1: Typical simulation parameters.
The speed of the shock front was determined by using the mean value of the magnetic field integrated along the y direction, áB ñ. The shock front was considered to be located at the position where this quantity reached 2 B0. In reality, this corresponds to a region close to the foot of the shock, but the speed of this point proved to be remarkably stable throughout a simulation. Studies of shock structure which used this point as a baseline produced results which were equivalent to simply assuming a constant speed for the shock front. As a result, we have used the point where áB ñ = 2 B0 as the origin for the x co-ordinate in the following discussion when quantities are described relative to the position of the shock front. The shock speeds for different cases using this criterion are shown in Table 4.2, where the shock Alfvén Mach number in the normal incidence frame, MA, is tabulated against the plasma inflow velocity in the simulation frame, Vin. The shape of the shock was not constant, however, so the position and height of the overshoot vary slightly over time.
Plasma inflow speed in shock Alfvén Mach number, MA
simulation frame, Vin qBn =85° qBn =88°
2 vA 3.32 3.33
4 vA 5.66 5.66
6 vA 8.29 8.21
Table 4.2: Relationship between the plasma inflow speed in the frame of the simulation (which is a parameter of the simulation) and in the frame of the shock (which gives the shock's Alfvén Mach number).

4.3  Overview of Structure

We conduct simulations using two orientations of the upstream magnetic field, B0. The first has B0 lying in the plane of the simulation, allowing particles to move along the field line and feel the full 2-D field structure. The second has B0 pointing out of the simulation plane, so that the particles feel no variation along the field line associated with 2-D structure. This configuration is intended to mimic a 1-D simulation.
th88_B_cmpts
th88_E_cmpts
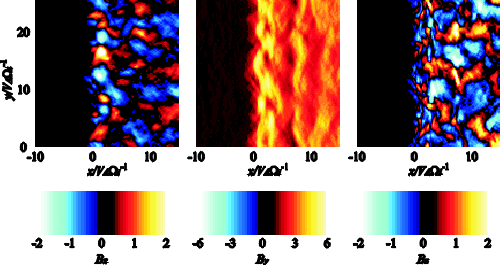
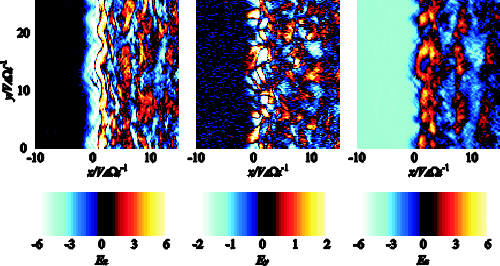
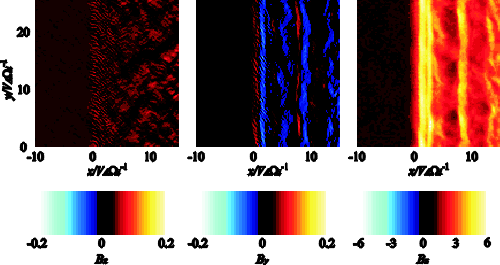
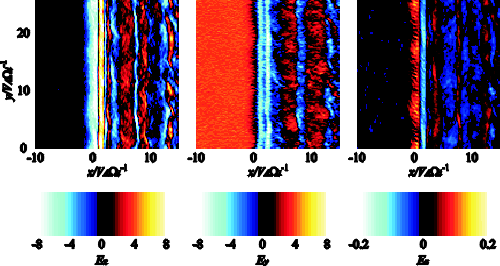
Figure 4.2: Diagram of all E and B components for qBn =88°, Vin=4vA for a simulation where the upstream magnetic field lies in the plane of the simulation.
th88_Btot    th88_Etot
th88_alfven    th88_rho
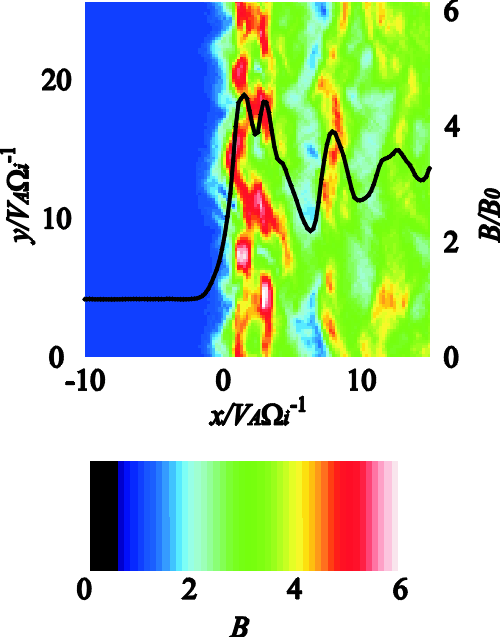
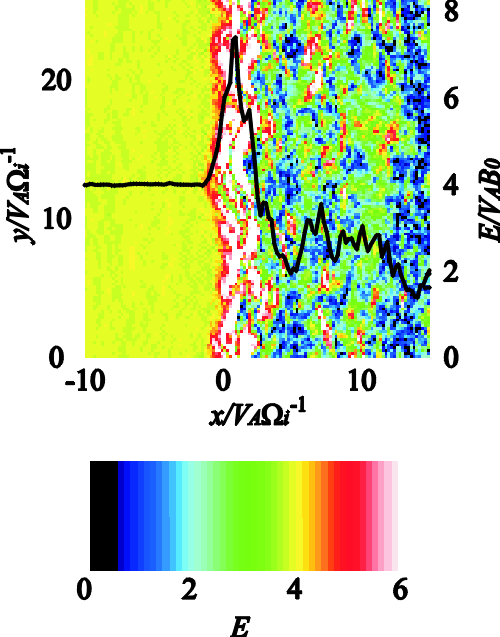
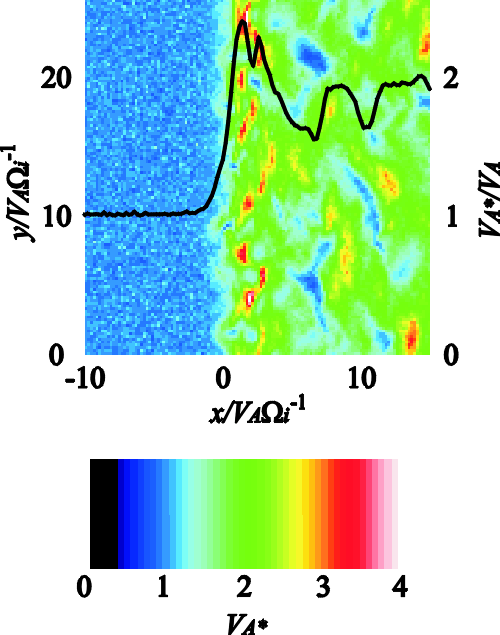
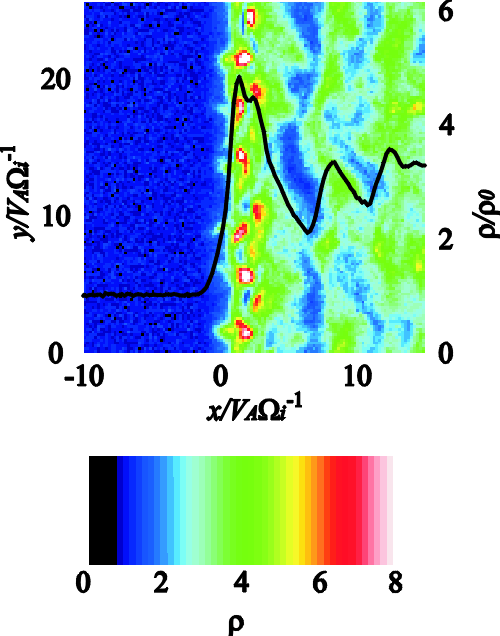
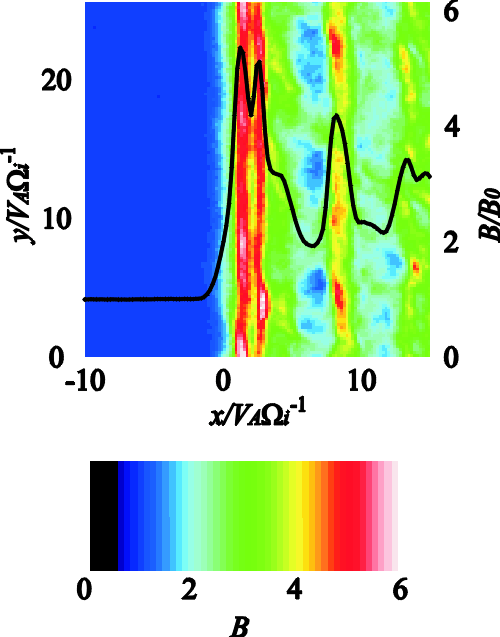
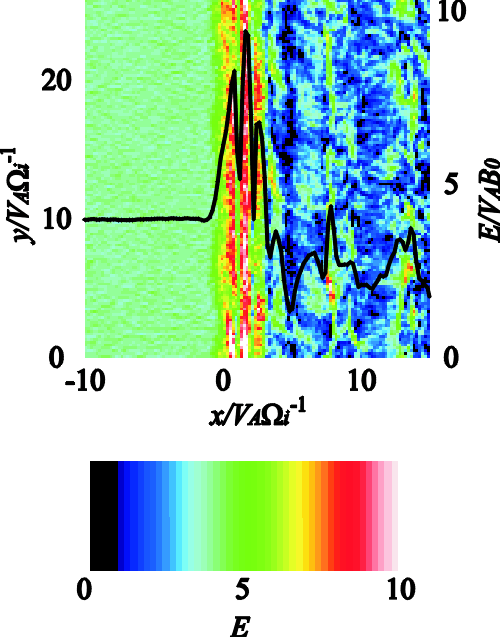
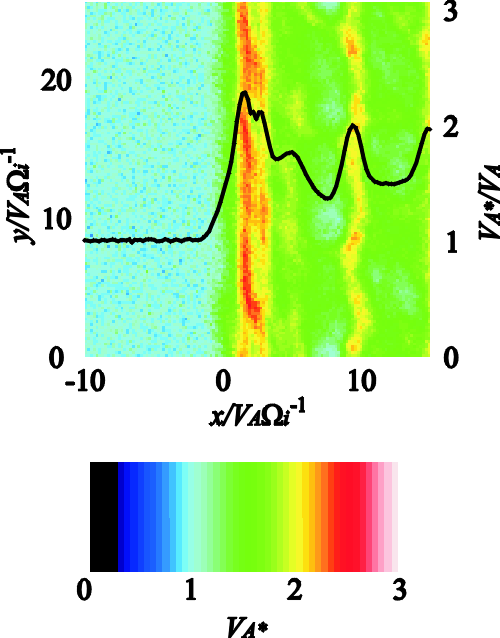
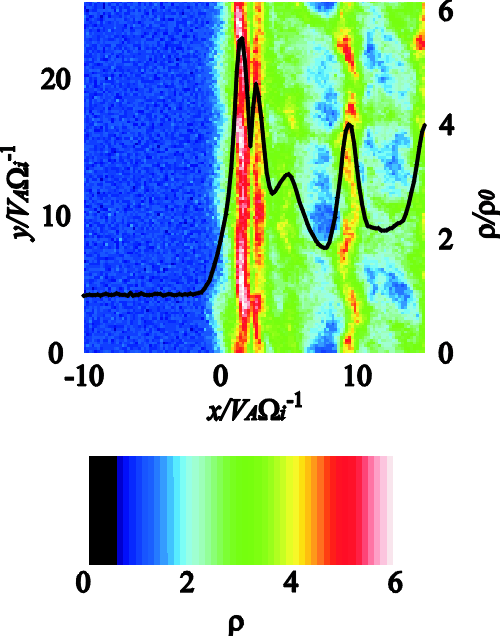
Figure 4.3: Diagram of Alfvén speed, density and the magnitudes of E and B components for qBn =88°, Vin=4vA for a simulation where the upstream magnetic field lies in the plane of the simulation.
th88_out_B_cmpts
th88_out_E_cmpts
Figure 4.4: Diagram of all E and B components for qBn =88°, Vin=4vA for a simulation where the upstream magnetic field points out of the plane of the simulation.
th88_out_Btot    th88_out_Etot
th88_out_alfven    th88_out_rho
Figure 4.5: Diagram of Alfvén speed, density and the magnitudes of E and B for qBn =88°, Vin=4vA for a simulation where the upstream magnetic field points out of the plane of the simulation.
Figures 4.2 and 4.3 show our simulation at qBn =88° with the upstream magnetic field, B0, lying in the simulation plane. These should be contrasted with Figures 4.4 and 4.5, which show the equivalent simulation when B0 is pointing out of the simulation plane so that the y and z axes are effectively interchanged. Figures 4.2 and 4.4 show maps of the magnetic and electric field components.
In our simulations, ripples are ion scale features at the shock front, which are seen to move along the shock surface. The ripples are most clearly visible in the shock normal component of the magnetic field in Figure 4.2, although there is also clear evidence of structure due to rippling in the largest field component, By. The waves caused by rippling can be seen in the Bx component with a wavelength of a few ion inertial lengths and an amplitude of around 2B0. These peaks also appear to be connected to structure behind the shock.
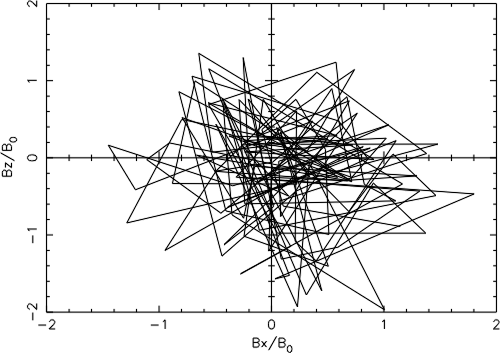
The Bz field component shows a significant amount of structure, although there is no obvious characteristic wavelength or correlation with any of the other magnetic field components. This lack of correlation is illustrated by Figure 4.6, which shows a hodogram of the Bx and Bz field components at the overshoot. This suggests that the two perpendicular wave directions are not related by the rippling mechanism. This result is in agreement with Winske & Quest [1988].
hodogram_bxz_th88m4
Figure 4.6: This hodogram illustrates the lack of correlation between the Bx and Bz field components at the overshoot.
The electric field components are related to the cross-product of the magnetic field and the plasma inflow velocity. Significant amounts of field structure are therefore seen in all the electric field components. The Ex component is the only one of the six field components in which the bimodal nature of the overshoot fields is visible.
This contrasts with Figure 4.4, where structure is suppressed by restricting spatial field variations along field lines. The Bx component is virtually eliminated, as would be expected for a one-dimensional shock. When compared to Figure 4.2, there is virtually no field structure along the y axis in any of the field components. As a result of this, the bimodal nature of the overshoot can be clearly seen in most of the magnetic and electric field components.
Figures 4.3 and 4.5 show maps of the density and Alfvén speed, in addition to the total electric and magnetic fields, for the two orientations of B0. Superimposed are graphs showing how the magnitude of the mapped quantities varies with distance from the shock front. These magnitudes are calculated by taking the mean value over the y direction, averaging over the 2-D structure.
All four quantities in Figure 4.3 show significant structure along the shock overshoot together with an uneven shock surface. Each of the graphs also shows evidence of a bimodal nature to the parameters at overshoot. The integrated fields in Figure 4.5 are broadly similar, although the lack of significant y structure in the shock front again means that the bimodal nature of the overshoot is better resolved when B0 is out of the simulation plane. This suggests that rippling does not significantly affect other properties of the shock, such as the shock width and the presence of the foot, ramp and overshoot. The similarity of the integrated fields in the two cases can therefore give us confidence that the two simulations are indeed comparable. The simulation with B0 out of the simulation plane allows us to compare the rippled shock front with a simulation comparable with those conducted by Krauss-Varban et al. [1989]. This gives us a choice of fields with and without ripples, but with similar simulation noise in both cases. This is particularly important when studying pitch angle scattering, since we know that this can be introduced by numerical effects, as discussed in Chapter 5.

4.4  Ripple Properties

The Bx field component would appear to be a useful diagnostic in determining the properties of ripples. If we wish to examine how the ripples in Bx vary with distance from the shock, the method of averaging the field component over a slice is inappropriate, as the field averages to zero, as would be expected for a 1-D shock. If, instead, we average the quantity Bx2 then we obtain a measure of the power in the ripples, which does not vanish when averaged over y. In fact, a good diagnostic for the amount of 2-D structure in any given quantity, Q, is its variance, Var(Q) = áQ2 ñ- áQ ñ2. For nearly perpendicular shocks, however, áBx ñ » 0.
varBx_vs_overshoot
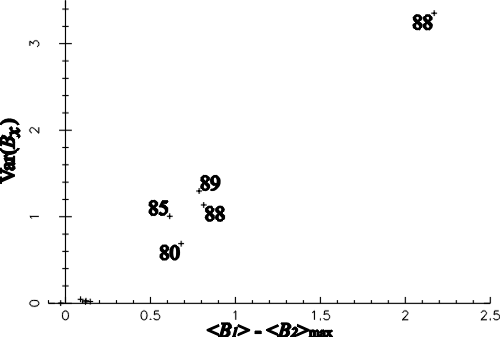
Figure 4.7: Graph showing how the power in the shock ripples increases with the size of the overshoot. The points from simulations with rippling are labelled with their value of qBn.
varBx_vs_tBn
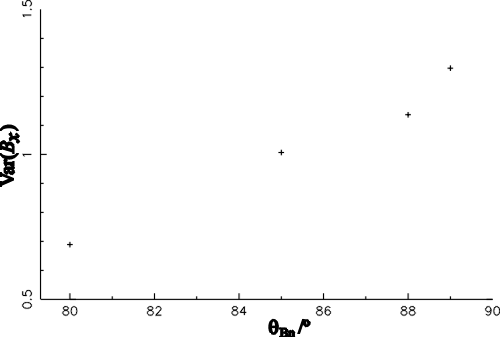
Figure 4.8: Graph showing how the power in the ripples increases with qBn for an inflow speed of 4vA.
Figure 4.7 plots Var(Bx) against (áB1 ñ- áB2 ñmax) for the sample of ten shocks that are used in the simulations described in Chapter 6. The properties of these shocks are listed in Table 6.2. Var(Bx) is a good diagnostic of the amount of structure in the Bx field component and provides a measure of the power in the shock ripples. The quantity (áB1 ñ- áB2 ñmax) is the difference between the maximum magnetic field in the shock transition and the maximum value of the downstream (x > 5 vA Wi-1) magnetic field, with both fields averaged over the y direction. This quantity gives a good idea of the size of the overshoot compared to the downstream fluctuations and falls to approximately zero in the case of a subcritical shock, which has no overshoot. This quantity depends very strongly on the inflow plasma speed, but much more weakly on qBn over the range qBn >~80°. Figure 4.7 is consistent with a linear relationship between the power in the ripples and the size of the overshoot. The c2 best fit is
Var(Bx) = 1.6 (áB1 ñ- áB2 ñmax) - 0.1
(4.1)
The existence of ripples therefore appears to require the presence of an overshoot, with the amplitude of the ripples being strongly dependent on the size of the overshoot. The outlying point above Var(Bx) = 3 is the strongest shock, with an inflow speed of 6vA. The cluster of four points around Var(Bx) = 1 all have an inflow speed of 4vA, but have different values of qBn. The range of (áB1 ñ- áB2 ñmax) for these four points is consistent with the variation seen during the course of a simulation. Figure 4.8 shows how Var(Bx) varies with qBn for the shocks in this cluster. This shows that qBn does have an effect on the strength of the ripples, with the power in the ripples increasing as qBn approaches 90°. The effect of qBn on the strength of the shock ripples is, however, significantly less than that of the size of the overshoot.
A significant approximation made in our simulations is that there are no upstream waves. We have seen that the strength of rippling seems to be determined by the height of the overshoot, rather than the angle between the upstream field and the shock front. The introduction of upstream waves might cause local variations in qBn, but would not affect the plasma inflow speed. This suggests that a reasonable level of upstream wave activity is unlikely to have a significant effect on ripple properties and that it is therefore reasonable to neglect upstream waves in our simulations.
th88_Btot    th88_Etot
th88_alfven    th88_rho
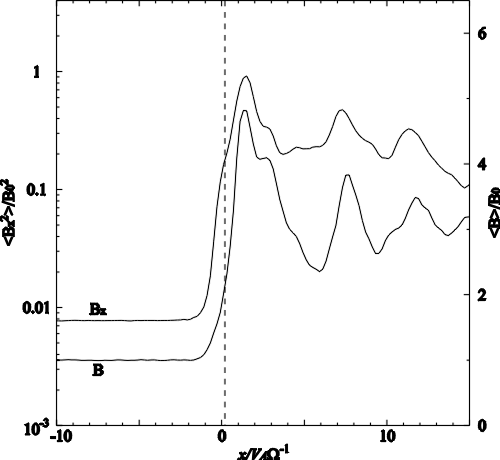
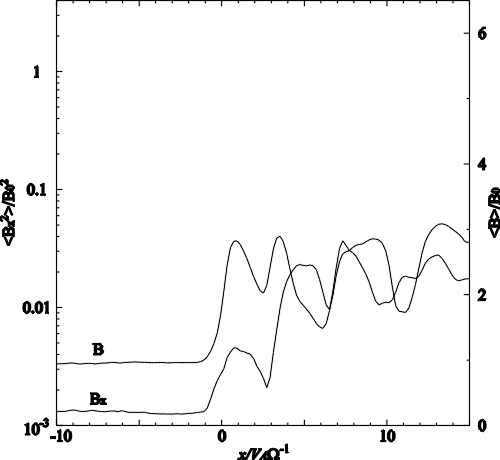
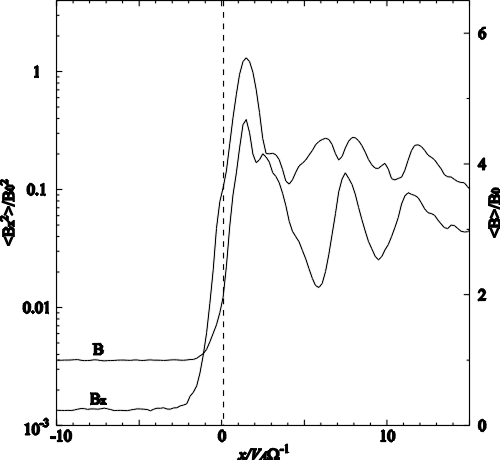
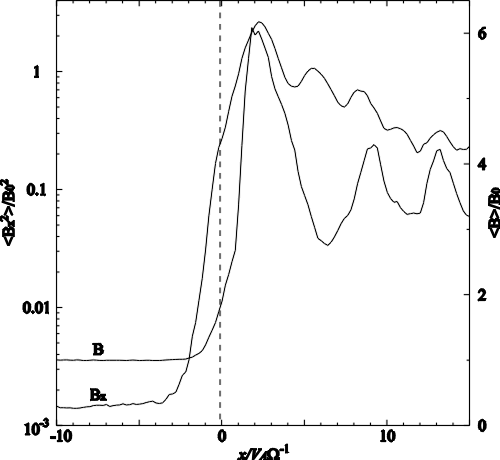
Figure 4.9: These figures show the how the square of Bx, integrated over the y direction, varies with x for a variety of different upstream parameters. The value of the total magnetic field integrated over y is shown for comparison. The áBx2 ñ quantity is an indicator of the power in the ripples at a given x. The location of a kink in the graph is indicated by a dashed line.
Figure 4.9 shows how the power in the ripples varies across the shock transition for a number of different shocks. The quantity áBx2 ñ is plotted logarithmically, since the dynamic range is large and the dependence of áBx2 ñ on x appears to be approximately exponential. The mean magnetic field strength, áB ñ, is shown for comparison on a linear scale. The strength of ripples increases with both the Alfvén Mach number, MA, and the angle between the upstream magnetic field and the shock normal, qBn. In the case of the qBn =88°, Vin=2vA shock, there is no evidence of rippling at the shock ramp, as the power in Bx is actually below that downstream of the shock. It should be noted that this is also the only shock that exhibits no clear overshoot.
The other three cases, however, do have appreciable rippling and have much in common. The power in Bx in the upstream region, which represents noise in the simulation, is at a low level and is approximately constant. The rise in power begins upstream of the shock foot and is approximately exponential. In this portion of the field, the e-folding length is approximately the same for all three cases. At a point in the shock foot, however, the field exhibits a kink in the exponential rise. Downstream of this point, the exponential form continues, but the rise is less rapid and the e-folding length differs between the three cases. The exponential rise ends in a turnover whose position coincides with the top of the overshoot. The power in Bx decays exponentially from this point until it reaches its downstream equilibrium value. The position of this kink is indicated in Figure 4.10 by a dashed line.
inflow_th85m4    inflow_th88m2
inflow_th88m4    inflow_th88m6
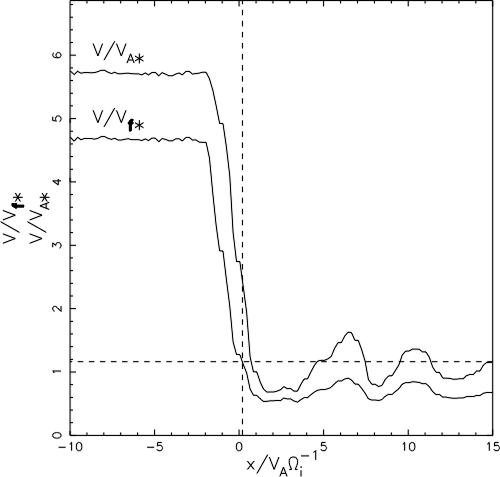
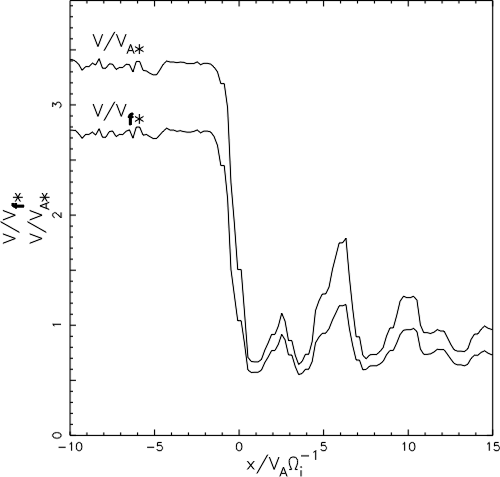
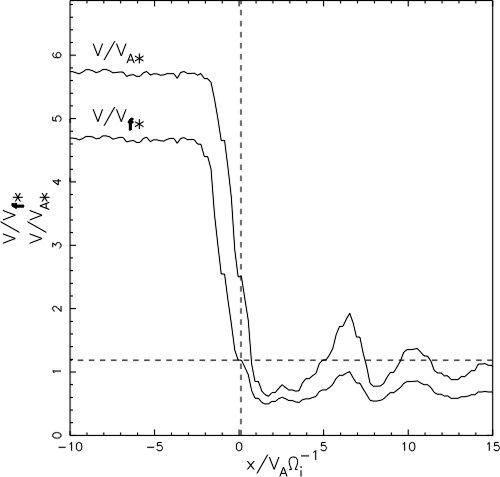
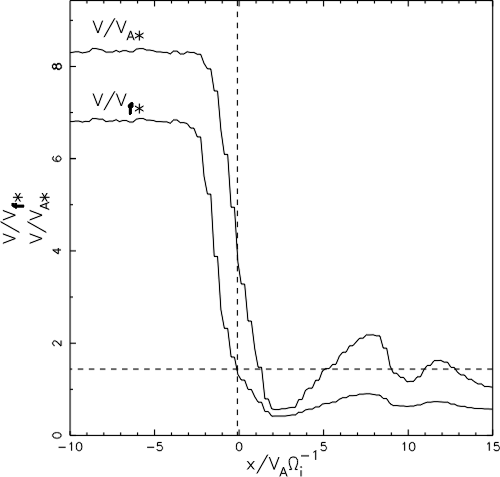
Figure 4.10: Graphs of the local flow speeds in units of the local fast mode and Alfvén speeds variety of shock transitions. The location of the kink in the ripple amplitude shown in Figure 4.9 is indicated by a dashed line.
The plasma flow speed is an interesting quantity within the shock structure, particularly in relation to the kink seen in the Bx field component. We can determine the speed of the flow by neglecting temporal variations and considering the continuity of the plasma, so that the quantity rv is conserved. The flow speed is useful in terms of the local Alfvén speed, vA*, since this is the characteristic speed for parallel propagating waves. We will use the * subscript to denote that the characteristic speed is calculated locally, and is not simply the upstream value that is defined by the initial conditions. In terms of the normalisation used in the simulation, vA* is given by
vA* =  B


Ö

r
(4.2)
so that the Alfvén Mach number of the flow is given by
MA = V0  1

B
Ö

r
(4.3)
The fast mode wave speed, vf, is the characteristic speed for perpendicular propagating waves. The determination of this quantity requires the sound speed, cs, since
vf* =
Ö
 

vA*2 + cs*2
 
(4.4)
In terms of the initial ion and electron betas, bi and be, the sound speed depends on the ratio of the ion temperature, T, to its upstream value, T0, such that
cs*2 =  1

2
æ
è
bi  T

T0
+ be ö
ø
(4.5)
so that the fast mode Mach number of the flow is given by
Mf =  V0

r
æ
è
 B2

r
+  1

2
æ
è
bi  T

T0
+ be ö
ø
ö
ø
-1/2

 
(4.6)
The quantities shown in Figure 4.3 can be used, along with the ion temperature and the parameters shown in Table 4.1 to determine the speed of the flow in terms of the Alfvén and fast mode wave speeds. The ion temperature is determined by calculating áv - [`(v)] ñ for each grid cell. McKean et al. [1995] report an ion temperature increase at the overshoot by a factor of around fifty over the upstream value, which results in a fast mode wave speed at the overshoot of vf = 3.7 vA. These figures are consistent with our temperature diagnostics.
Figure 4.10 shows graphs of the plasma flow speed in the shock rest frame as a function of x in terms of the local Alfvén and fast mode wave speeds. The graphs were obtained using Equations 4.3 and 4.6 and averaging the results over y. A comparison of Figure 4.9 with Figure 4.10 shows that, for all shocks except for the Vin=2vA case, the position of the kinks in the Bx power graphs correspond to a local flow velocity of (1.26 ±0.16) vf*. This figure is rather sensitive to the exact position used to determine the velocities and is therefore consistent with the position of the sub-fast transition. In all cases the sub-fast transition occurs near the top of the shock foot, with the Alfvénic transition occurring further downstream near the overshoot. Although the fast mode and Alfvén speeds and transitions are not dramatically different, the position of the kink seems to be consistent with the fast mode transition, but not the Alfvénic transition. This is significant because MHD waves are unable to propagate upstream of the fast mode transition, so the steepening of the Bx rippling upstream of the kink may be evidence of evanescent behaviour. In Section 4.6, we discuss how these results suggest that the ripples might be a form of surface mode.

4.5  Fourier Analysis

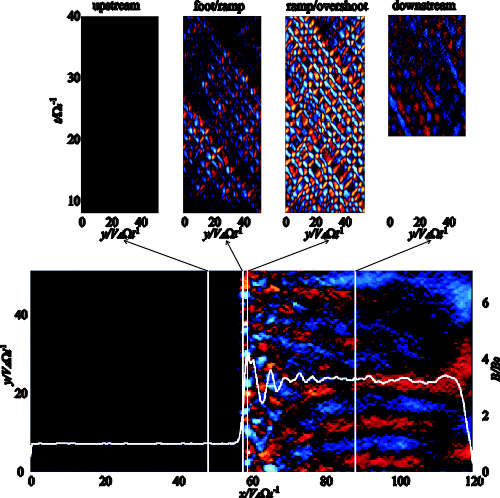
In order to further characterise the properties of the Bx ripples, we can apply Fourier analysis to determine their dispersion relation. We do this by taking a time series of Bx field slices at a constant distance from the shock front. These field slices, along with their position relative to the shock, are shown in Figure 4.11. Taking the Fourier transform of these y-t slices has the effect of inverting the axis quantities, so that the result is a map of wave amplitude in w-k space. We square these quantities to obtain a power spectrum. The line of maximum power in these maps gives us the waves' dispersion relation.
FT_slices
Figure 4.11: These slices of the Bx field (top) were taken in the shock frame at the positions indicated (bottom). The colour scale is the same as that used for the Bx component in Figure 4.2.
We calculate our Fourier transforms using a fast Fourier transform algorithm in 2-D, as implemented by Press et al. [1992]. It is a feature of Fourier transforms that the data are assumed to be periodic. In addition, the fast Fourier transform algorithm requires that the data be supplied on a grid whose axes have a length in grid cells that is a power of two. In our simulations, the y boundary conditions are periodic and we set the number of cells in the y direction to be a power of two. In the time direction, however, we must pad the data with zeros in order to make the number of grid cells up to a power of two. The time boundary is also not periodic, so we are effectively introducing a discontinuity in t that can produce high frequency artifacts such as signal leakage.
Data windowing, in which the data set is multiplied by a windowing function, reduces the extent to which a signal in a power spectrum leaks into neighbouring cells. This is particularly important in our data sets, where most of the power lies in a small number of bins. We find that the simplest choice of windowing function, the Bartlett window, works well. The Bartlett windowing function is zero at the edges of the data segment and rises linearly to a value of one in the centre.
Only frequencies that lie below a critical frequency, termed the Nyquist frequency, fN, are included in a Fourier transform. This range of frequencies is determined by the sampling interval, Dt, such that
fN =  1

2 Dt
(4.7)
Power above this frequency is folded back over below fn, or "aliased" into the Fourier transform, and is effectively a source of noise. Similarly, the critical wavenumber, kN, depends on the spatial grid size, Dy. The resolution of the Fourier transform is governed by the number of data points to be transformed, as the number of cells on the axes of the Fourier transform is equal to the number of cells on the equivalent data axes. This effectively means that the lowest resolvable frequency depends on the length of the data set and the highest resolvable frequency depends on the sampling interval.
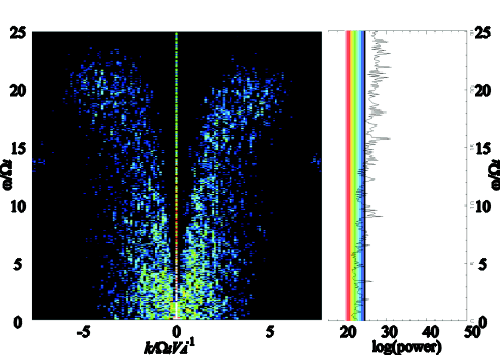
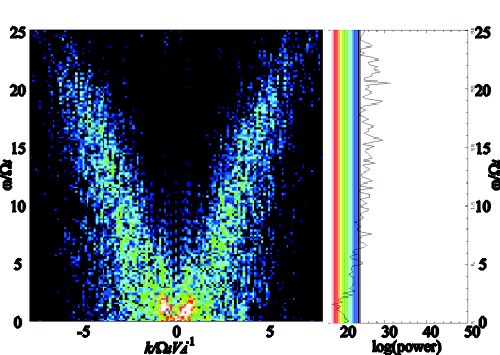
FT_spectra_upstream FT_spectra_downstream
Figure 4.12: The Fourier plots (left) show the w-k distribution of power for the Bx slices (Figure 4.11) using a logarithmic scaling. The w-power plots (right) show slices through the w-k diagrams at k=1 (8th Fourier mode). Figure 4.13 shows equivalent diagrams for regions inside the shock.
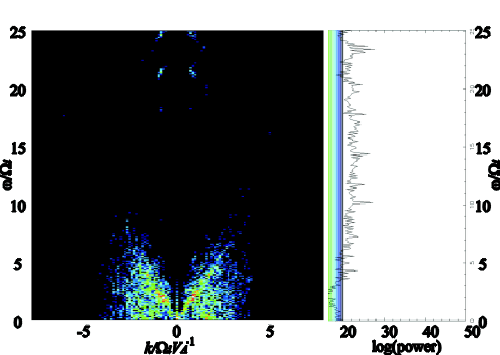
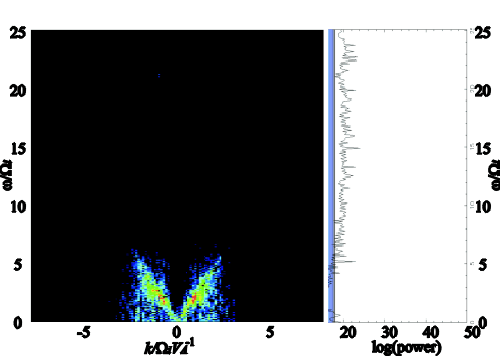
FT_spectra_foot    FT_spectra_overshoot
Figure 4.13: The Fourier plots (left) show the w-k distribution of power for the Bx slices (Figure 4.11) using a logarithmic scaling. The w-power plots (right) show slices through the w-k diagrams at k=1 (8th Fourier mode). Figure 4.12 shows equivalent diagrams for regions outside the shock.
Figures 4.12 and 4.13 show w-k power spectrum maps of field slices at various positions relative to the shock front. The dynamic range of these maps is sufficiently large that the power is plotted on a logarithmic scale. Also shown are slices through these maps at k=1 (the 8th Fourier mode), which show how the power varies with w. These slices provide a colour key and illustrate the noise level in the w-k maps.
Figure 4.12 shows that there is no significant wave activity upstream of the shock. It is difficult to resolve a dispersion relation and the power graph at k=1 suggests that any signal is lost in noise. The downstream power graph shows a peak at w » 1.5 Wi. There is definite wave activity on the w-k map, although it is difficult to resolve a dispersion relation. This is because we are effectively measuring k||, but the frequency determined by the fast mode dispersion relation depends on |k|, not k||. For a given k|| we therefore sample waves at a range of k and hence a range of w. These results are consistent with the field slices in Figure 4.11.
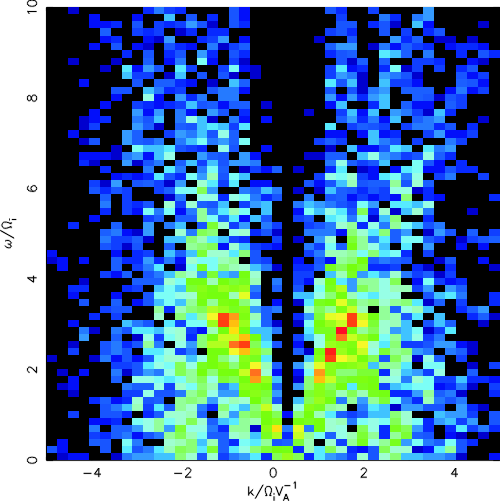
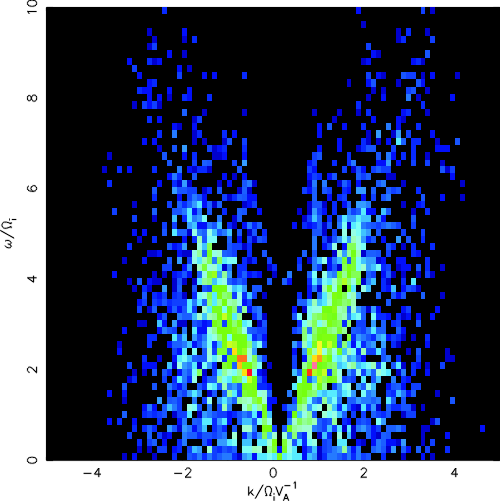
Figure 4.13 shows that the wave activity in Bx within the shock front is considerably different from that outside. There is significantly more power in the k=1 slices, with the peak at w » 2 Wi being at a slightly higher frequency that for the downstream waves. There is also significantly more power at the overshoot than at the foot, which would be consistent with the exponential growth seen in Figure 4.9. Although the ripples in Bx look like "blobs" of field structure, they actually show very clear wave mode properties. The power spectrum shows a clear dispersion relation, in contrast to the downstream spectrum. The signal remains clear up to around |k| = 2.5 Wi vA-1. This value is much higher than that for downstream waves, but the fact that it is approximately constant between the foot and the overshoot, which have very different power to noise ratios, suggests that this may be a real high frequency cut-off. The region of maximum power in Figure 4.13 corresponds to a few ion inertial lengths, which agrees with the apparent wavelength of the ripples seen in the Bx field component in Figure 4.2.
Plasma inflow speed [(w)/(k)]
Vin - branch + branch
2 vA -1.68 vA 1.76 vA
4 vA -2.34 vA 1.97 vA
6 vA -2.54 vA 2.73 vA
Table 4.3: Relationship between the plasma inflow speed in the frame of the simulation, Vin, and the c2 best fit gradient of the dispersion relation for a range of shocks with qBn =85°.
The dispersion relation for these waves appears to be linear, with equal phase and group velocities. If
w = mk+c
(4.8)
then a c2 fit is suitable for determining the dispersion relation and hence the phase and group velocity of the ripples. We use a statistical weight for each power point equal to the logarithm of the power at that point. The fitting is done only over that part of the spectrum with |k| < 2 Wi vA-1, since the presence of a high frequency cut-off means that the signal becomes lost in noise outside this range. By inspection of Figure 4.13, we expect the dispersion relation to pass through the origin. Our c2 fits, however, produce values of c as high as 1. This is clearly an inappropriate fit and can be explained by the fact that the points in the w-k map that carry most power (and hence statistical weight) are spread over a few cells in w, probably as a result of signal leakage, which is not completely eliminated by the Bartlett windowing. We found that setting c=0 produced much more realistic c2 fits. Using this method, we obtain c2 best fit velocities for the ripples for a variety of shock Mach numbers at qBn =85°. These results are shown in Table 4.3.
dispersion_chart
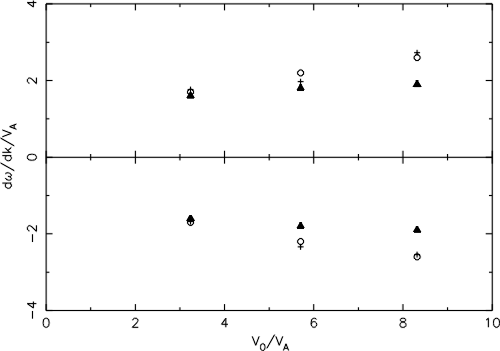
Figure 4.14: Chart correlating the speed of ripples to other significant wave speeds at qBn =85°. The crosses correspond to the measured best c2 fit to the ripple speed, the open circles to the overshoot Alfvén speed and the solid triangles to the downstream Alfvén speed.
We can compare the speed of the ripples with wave speeds within the simulation. Since the speed that we have calculated is really just the parallel (y) component of the ripple phase speed, the appropriate wave speed to compare is with is the Alfvén speed, which is the characteristic parallel wave speed. It is straightforward to calculate the overshoot and downstream Alfvén speeds because we can read off r and B directly from our simulation, from which we can calculate both the local and averaged Alfvén speeds (Figure 4.3). Figure 4.14 compares these waves speeds with the speed of the ripples. The plasma inflow speeds are shown in the frame of the shock, as opposed to the frame of the simulation used in Table 4.3. This graph shows that the ripples move along the shock front at a speed that is consistent with the Alfvén speed at the overshoot [Lowe & Burgess, 1999a].
FT_Bx_component
FT_By_component    FT_Bz_component
Figure 4.15: Fourier transforms of the three magnetic field components of a field slice running along the shock overshoot of a qBn =88°, Vin=4vA simulation.
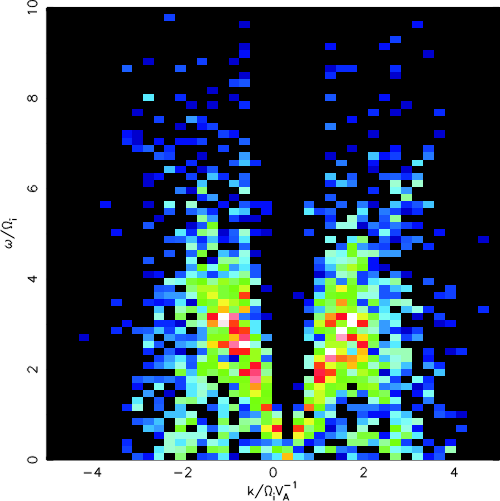
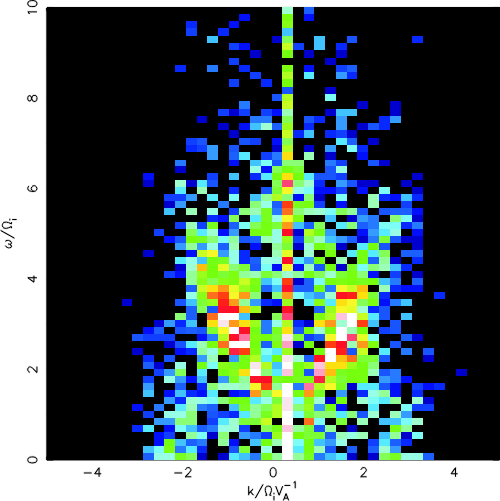
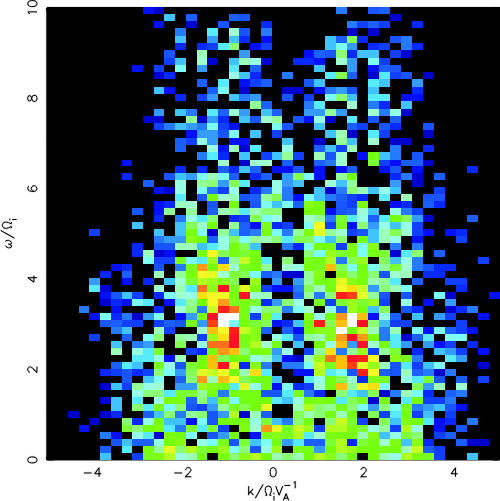
In order to look at the properties of ripples in the other field components, we have looked at the Fourier transforms of all three magnetic field components. Figure 4.15 shows three Fourier transforms for a field slice running along the overshoot of a qBn =88°, Vin=4vA simulation. As we have seen previously, the Bx component has clear wave mode properties with both group and phase velocities approximately equal to the overshoot Alfvén speed. The peak signal is at around |k| = 1.4 Wi vA-1 and w = 3 Wi.
The By field component has a large amount of power across all frequencies at k=0. This is a result of the movement of the whole shock front with respect to the frame in which the Fourier transform is taken. Outside k=0, there is evidence for wave mode properties similar to the Bx field component, but with a low frequency cut-off at around w = 1.5 Wi. The position of the peak signal corresponds to that in the Bx component. The Bz behaviour is very different to the Bx and By components, with no clear dispersion relation. There is a strong signal at a position corresponding to the maxima in both the Bx and By components. The power at this frequency is distributed over a range of k, which may correspond to a wave with a very large group velocity, or to signal leakage through k. Apart from this peak, there is relatively little power at other frequencies.
These results confirm that the properties of the ripples are clearest in the Bx field component, but also suggest that further work on the other field components will be needed for a complete understanding of the waves processes at the overshoot.

4.5.1  Numerical dependence

th88bp5m4a_Bx_FT_full
th88bp5m4c_Bx_FT_full
Figure 4.16: Fourier transforms of the Bx field component for simulations with different numerical parameters. These graphs do not show the whole range of the Fourier transform, as only the region with |k| < 2 was used to fit a dispersion relation. Outside this range, any signal becomes lost in noise.
It is important to ensure that our results are neither a result of, nor significantly dependent on, the numerical resolution of the simulation grid. Figure 4.16 shows Fourier transforms of the Bx field component for simulations with different numerical parameters. The first case represents our standard simulation parameters. In the second case, we have doubled both the spatial grid spacings, Dx and Dy, and the time step, Dt. If any of the properties of the ripples are dependent on numerical resolution, we would expect features of the ripples to scale with at least one of these.
Dx Dy Dt [(w)/(k)]
- branch + branch
0.2 vA Wi-1 0.2 vA Wi-1 0.01 Wi-1 -2.21 vA 2.19 vA
0.4 vA Wi-1 0.4 vA Wi-1 0.02 Wi-1 -2.40 vA 2.34 vA
Table 4.4: Fourier spectrum c2 best fit dispersion relations for a high and low resolution case to illustrate that our results are not resolution dependent.
The form of the w-k power maps appears to be consistent across the two cases, with both spectra showing a linear dispersion relation with a high frequency cut-off at around |k| = 2.5 Wi vA-1. The c2 best fit dispersion relation gradients are shown in Table 4.4. These agree to within 10%, which is small compared to the dramatic change in numerical resolution. We therefore conclude that the Bx ripples do not show significant numerical dependence.

4.6  Shock Surface Modes

surface_wave_sketch
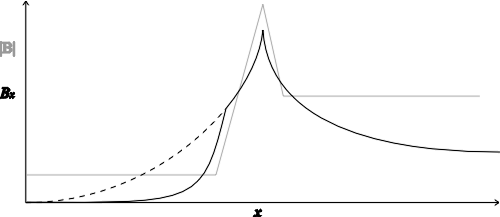
Figure 4.17: A sketch of our model for a shock surface wave. The surface mode consists of a pair of exponential solutions which meet at the top of the overshoot. At a point upstream of the overshoot, the local flow velocity exceeds the local fast mode wave speed and the surface mode's exponential solution (dotted line) decays into an evanescent wave.
We argue here that collisionless shocks may be able to support a surface mode. The existence of a surface mode at tangential discontinuities is described by Hollweg [1982]. His analysis consists of considering the MHD equations and making a number of simplifying assumptions. He considered a cold plasma, with constant density and field magnitude across the discontinuity. The regions on either side of the discontinuity are homogeneous, and the discontinuity consists only of a change in the magnetic field direction. The surface mode is then identified by matching exponential solutions on either side of the discontinuity and introducing a boundary at infinity at which the wave amplitude goes to zero. This has the effect of constraining the solution to the region of the discontinuity.
A surface mode analysis is significantly more complicated for the discontinuity at a shock overshoot. This is because the density and magnetic field strength are very strong functions of position. The main difference is that, in the case of a collisionless shock, the discontinuity surface is treated as being the top of the overshoot and the upstream region is that portion of the shock ramp lying between the top of the overshoot and the sub-fast transition. Upstream of this point, the flow speed is greater than all plasma wave speeds and the surface mode becomes evanescent. This transition corresponds with the kink that we observe in the Bx field component. A schematic view of our model is shown in Figure 4.17.
In a shock surface mode treatment, the cold plasma assumption is also questionable, since the ion temperature can increase by a factor of fifty at the overshoot [McKean et al., 1995]. The nature of the discontinuity is different too. In the case of the tangential discontinuity, the direction of the magnetic field changes discontinuously. At the shock overshoot, it is the rate at which the field changes magnitude that is discontinuous. The mode described by Hollweg [1982] has a propagation velocity along the discontinuity that is determined by the wave speeds on either side of the discontinuity. Although an analytical surface mode analysis is difficult in the shock case, we would expect any surface mode to share these two properties. Since our analysis of the ripples lies in a direction that is parallel to the magnetic field, we would therefore expect the characteristic wave speed to be the overshoot Alfvén speed. Also, since this is a surface mode, it should decay exponentially with distance from the discontinuity. These expectations are consistent with our simulations.
If such a mode exists in a shock, there is likely to be sufficient energy available to excite it. There is nothing to stop the surface mode being driven by an Alfvén Ion Cyclotron instability resulting from the reflected ions, as suggested by Winske & Quest [1988]. More work is needed to conclusively identify the wave mode responsible for rippling and to determine the source of the driving energy.

4.7  Summary

Our analysis has shown, for the first time, some new features of the shock ripples. The power in the ripples varies with distance in an approximately exponential manner, reaching a maximum at the overshoot. The graph of power with position exhibits a kink which means that the ripple power drops off upstream of a point which corresponds to the super-fast transition. The ripples become weaker as the inflow velocity decreases and the existence of ripples seems to depend on the existence of an overshoot. Finally, the ripples propagate at the overshoot Alfvén speed, possibly with a high frequency cut-off. We argue that these properties are consistent with the ripples being a surface mode.


Page Maintained By : Rob Lowe
Last Revision : 1st March 2003