Chapter 5
Electron Populations in a Quasi-Perpendicular Shock

The usual assumptions of electron acceleration by adiabatic reflection are that the shock structure is stationary, one-dimensional and that the electron gyroradius is much smaller than the shock thickness. In our simulations in Chapter 4 these approximations are violated: we observe ripples at the ramp and overshoot. These are magnetic structures that are time dependent and cannot be approximated as one-dimensional. In this chapter, using our hybrid simulation and a relativistic test particle code, we examine the effect of ripples on electron acceleration. We propose a new acceleration mechanism based on Fermi acceleration of electrons by structure within the shock transition. We show how trapping by this two dimensional structure can cause electrons to be convected downstream with the magnetic field, despite having magnetic moments which suggest that they should be reflected upstream. These electrons undergo considerable Fermi acceleration during the shock transition and may explain observations of an energetic population of electrons downstream of Earth's bow shock. Preliminary results have been presented in Lowe & Burgess [2000].

5.1  Previous Work

Observations by spacecraft in situ at the Earth's bow shock [Fan et al., 1964,Anderson et al., 1965,Anderson, 1974] show that it is capable of accelerating electrons to energies up to 100 keV. This suprathermal distribution appears as spikes of energetic electrons in a narrow region both upstream [Anderson et al., 1979] and downstream [Fan et al., 1964,Anderson, 1969,Anderson, 1974,Gosling et al., 1989] of the nearly perpendicular region of the shock surface. On the other hand, energetic electron fluxes are not present at this level near the quasi-parallel region of the shock.
Gosling et al. [1989] studied ISEE 1 and 2 data to examine this suprathermal electron population in the region 1-20 keV. These electrons are seen upstream as a field-aligned beam, but elsewhere the distribution has no significant anisotropy. The suprathermal flux contributes substantially to the total electron temperature and peaks immediately downstream of the shock, with the highest energy electrons appearing in the overshoot. The electron energy spectrum has a power law tail that is assumed to continue at least as far as the 100 keV energies that were previously seen. The distribution immediately downstream of the shock had an exponent ranging from -3 to -4. This compares with the exponent of -2 to -3 reported by Anderson [1981] for the upstream distribution.
The most widely accepted theory for producing high energy electrons at the quasi-perpendicular shock is adiabatic reflection. This produces beams of field-aligned electrons upstream of the shock whose energy is very strongly dependent on qBn. It may therefore be possible to explain the upstream suprathermal population by this mechanism, but adiabatic theory alone does not allow a power law spectrum of energetic electrons to be produced downstream of the shock. This theoretical approach does make some very strong assumptions: the electrons' magnetic moments are assumed to be conserved and the shock structure is assumed to be static. Simulation results weaken these constraints, but do make some assumptions, for example studying a one dimensional shock means that the effects of structure along the magnetic field cannot be considered. We here discuss the application of adiabatic theory and look at previous work that has been done with simulations.

5.1.1  Adiabatic theory

The basis of adiabatic electron acceleration [Leroy & Mangeney, 1984,Wu, 1984], which assumes the conservation of magnetic moment, m, was discussed in Chapter 2 and the various reference frames relevant to shock physics are discussed in Section 1.4.2. We now look in detail at the expected properties of the electron distribution after adiabatic reflection at the shock [Lowe & Burgess, 1999b]. In Section 2.4.3 we showed that the velocity components in the reflected distribution are:
v||r = -v|| + 2 VHT ·
^
B
 

0 
(5.1)

v^r=v^
(5.2)
For the purposes of this discussion, we will examine the properties of electrons in the initial plasma frame. We will therefore use VHT = VHT|IPF ·[^(B)]0, which is negative and can be calculated using Equation 2.15. We shall express electron velocity components in terms of the pitch angle, a, and the initial velocity, v, both in the initial plasma frame:
v||=vcosa
(5.3)

v^=vsina
(5.4)
In our simulations, the initial electron test particle distribution consists of particles distributed randomly and uniformly over a spherical shell in velocity space. Since the initial population of electrons is distributed over a sphere, the distribution of pitch angle, a, is
f(a) \thinspace da µ sina\thinspace da
(5.5)
We can calculate the fraction of reflected ions by finding the values of a between which reflection should occur:
 Fr

Ftot
=  cosamin-cosamax

2
(5.6)
Conservation of magnetic moment leads to a constraint on a, which must be between the two solutions of
acos2a + bcosa + c = 0
(5.7)

a=  B1

B0
(5.8)

b=-2  VHT

v
(5.9)

c=
e
~
f0
 

 1

2
mv2
+ æ
è
 VHT

v
ö
ø
2

 
-  B1 - B0

B0
(5.10)
th88_adiabatic_up
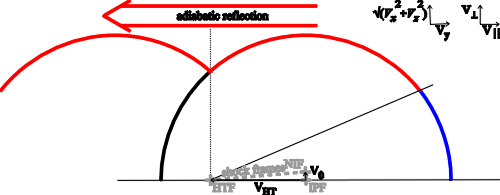
Figure 5.1: Velocity space diagram showing adiabatic reflection for a shock with qBn =88°, V0=4vA. The reflected population is shown in red and the population that transmits is in blue.
th85_adiabatic_up
Figure 5.2: Velocity space diagram showing adiabatic reflection for a shock with qBn =85°, V0=4vA. The reflected population is shown in red, the population that transmits is in blue and the population that never interacts with the shock is black.
For VHT less than the initial electron velocity, v, this may lead to two regions of the electron distribution being transmitted by the shock, as illustrated in Figure 5.2. If VHT ³ v, as in Figure 5.1, there can only be one region of the distribution that is transmitted. This is a result of the fact that the critical pitch angle required for reflection is determined in the de Hoffman-Teller frame, whereas we are looking at the pitch angle distribution in the initial plasma frame.
Figure 5.2 shows that, when VHT < v, there may be a fraction of the initial electron distribution that immediately escapes upstream without interacting with the shock. This population can play no further role in producing energetic electrons. In order to make best use of computational resources we disregard this population in our simulations and modify the value of Ftot accordingly. This initial cut-off in pitch angle is given by
cosacut-off £  VHT

v
(5.11)
This set of angles specifies how, given the initial pitch angle of an electron, its destination can be determined. Using the velocity components, we can calculate the final energy of a reflected electron with initial pitch angle a.
Efinal = Einit + 2 m \thinspace VHT2 + m v cosa\thinspace VHT
(5.12)
We can calculate the energy spectrum, f(E), of the reflected population in the initial plasma frame. Differentiating the final energy with respect to a,
 dEfinal

da
= m v sina\thinspace VHT
(5.13)
Combining this with Equation 5.5 shows that the reflected electrons have a flat energy spectrum. Their energies lie between two values, Emax and Emin, which may be determined by applying Equations 2.19 and 2.20 to the critical angles amin and amax. The energy distribution is therefore:
f(E) \thinspace dE =  1

Emax-Emin
\thinspace  Fr

Ftot
\thinspace dE
(5.14)
for Emin £ E £ Emax and f(E) = 0 otherwise.
th88_adiabatic_down
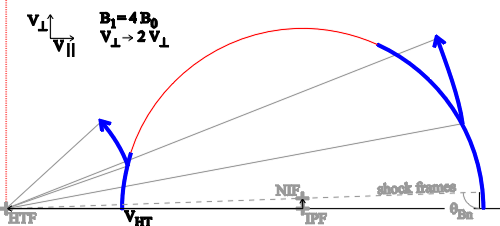
Figure 5.3: Velocity space diagram showing adiabatic transmission for a shock with qBn =88°, V0=4vA. The reflected population is shown in red and the population that transmits is in blue.
In the de Hoffman-Teller frame the transmitted population is accelerated only by the cross-shock potential, f. In order to conserve magnetic moment, however, the v^ velocity component must increase. If we disregard f, the transmitted electron will have a perpendicular velocity component of
v^ =   æ
Ö

 B1

B0
 
\thinspace v^
(5.15)
with a corresponding reduction in v|| in order to conserve energy. Using these velocity components, we can calculate these final energy of a transmitted electron with initial pitch angle a:
Efinal = Einit + m \thinspace VHT2 + m v cosa\thinspace VHT - m v \thinspace VHT \thinspace   æ
Ö

æ
è
 VHT

v
+ cosa ö
ø
2

 
+  B0 - B1

B0
sin2 a
 
(5.16)
This produces no acceleration for a = 0° or a = 180°, where Efinal = Einit. Electrons with high m are preferentially accelerated, as shown in Figure 5.3. Under ideal conditions, the maximum possible acceleration is produced when a = 90° and
 B0 - B1

B0
æ
è
 v

VHT
ö
ø
2

 
= 1
(5.17)
producing acceleration by a factor of
 Efinal

Einit
= 1 + 2  VHT

v
(5.18)
These predictions of the upstream and downstream electron properties produced by adiabatic theory provide a baseline against which to compare our results.

5.1.2  Simulations

Krauss-Varban et al. [1989] ran simulations which aimed to study the effect of removing some of the tight restrictions required by adiabatic theory. In this work, the shock front was modelled by a one-dimensional hybrid code and electrons were studied by integrating the trajectories of test particles through the fields produced by the hybrid simulation. This has the effect of removing the constraints that the magnetic moment of electrons should be conserved throughout the shock transition and that the shock front must have a static profile. The shock potential is also calculated in a self consistent manner. They found results that agreed well with adiabatic theory, subject to some scatter and heating in perpendicular energy which was felt to be related to short wavelength noise present in the hybrid code. In particular, it was found that electron acceleration was particularly sensitive to qBn, with the greatest acceleration occurring only when qBn was very near 90°.
Krauss-Varban & Burgess [1991] extended this work by looking at the effects of the curvature of the bow shock. This was felt to be particularly important because, according to adiabatic theory, the more highly energised an electron, the longer the interaction time with the shock and the greater the interaction length. Electrons with energies above several keV were found to interact with the shock over distances of more than 1000  vA Wi-1. The shock's radius of curvature is Rc » 5000  vA Wi-1 and could therefore play an important role. This work used a modified version of the simulations in Krauss-Varban et al. [1989] which took into account the variation in qBn as electrons moved along the shock front. This drift of electrons through a range of qBn caused the fraction of high energy electrons found upstream to be significantly reduced. The highest energy electrons were found to come from the part of the initial electron distribution with a high magnetic moment. This is not surprising, but does preclude the production of energetic electrons from the bulk of the initial distribution. An additional observed effect, however, was a focussing of electrons at a given energy to particular points along the shock front. Significantly, the flux of the highest energy electrons was found to focus into a small area. They argue that this focussing effect could explain the spikes of energetic electrons and their confinement to a narrow area.
Krauss-Varban [1994], building on the work of Krauss-Varban et al. [1989] and Krauss-Varban & Burgess [1991], sought to identify the origins of the downstream energetic electrons. This work also suggested that pitch angle scattering within the shock front may be responsible for the transmission of energetic electrons through the shock. No physical mechanism was identified, however, and artificial scattering was introduced into the shock transition. Such scattering produces a downstream electron population with a power law spectrum. This is as expected, since artificial scattering leads to stochastic acceleration. We saw in Section 2.4.1 that this will lead to a power law spectrum of accelerated electrons.
The First Order Fermi acceleration of electrons in a collapsing magnetic trap was studied by Gisler & Lemons [1990]. In their work, they used a 3-D test particle simulation to model reflection by approaching magnetic mirrors that are produced when curved (or straight) flux tubes flow into a straight (or curved) shock. The acceleration therefore continues until either the entire trap has convected through the shock or the electron has sufficient energy to leave the trap. This mechanism has a number of drawbacks, however, which make its applicability to the bow shock questionable. The trap cannot be too small, because then it becomes comparable with electron scales and magnetic moment is no longer conserved. However, Gisler & Lemons [1990] found that most of the energy gain occurs in the final interactions with the mirrors, when this is most likely to become an issue. The acceleration process depends very strongly on the initial energy, since this governs the time between reflections. The initial energy studied was 2 keV, which is significantly higher than typical solar wind energies at Earth's bow shock. The electron distribution was found to be bulk heated, with a small number of electrons being accelerated to many times their initial energy. The distribution did not, however, have a power law tail, so this mechanism cannot reproduce the observed properties of the highest energy electrons.
Vandas [2001] conducted a study of shock drift acceleration in which the effects of shock thickness, the angle qBn, shock curvature and plasma inflow velocity were investigated. His investigation used a test particle code with fields generated by a model which included shock structure and curvature. He also attempted to produce simulated results for a "hypothetical spacecraft" to compare with real spacecraft data. His comparison with observations showed that the focussing effect of the shock curvature can be used to identify the origins of energetic electron spikes. The difficulty of reproducing the observed power law tail of the electron distribution above 10 keV was, however, not overcome. Changing the field profile was not found to have a large effect and variation in the shock thickness, curvature and inflow speed produced an increased flux of reflected electrons with no corresponding increase in energy. The calculated electron distributions were strongly anisotropic, with spectra that could not be fitted by a power law. The work therefore shows that shock drift acceleration probably occurs in Earth's bow shock in the manner suggested by Krauss-Varban & Burgess [1991], but that the most energetic electrons cannot be explained by simply altering the shock properties used in the model.

5.2  Simulation Configuration

Using a two dimensional hybrid simulation and a test particle code, we examine the effect of ripples on electron acceleration. This is done by taking the time varying fields from a self consistent hybrid shock simulation for every time step and using them in a test particle simulation of suprathermal electron motion. We use the CAM-CL hybrid code and shock configuration described in Chapter 3, which means that electrons' contribution to the field structure is not well modelled. In the context of shocks, this means that we do not see some effects that occur in full particle simulations, such as electron scale ripples, but we do observe ion scale ripples, which are generally too large to be modelled by existing full particle PIC codes. In our configuration, the shock is planar, so we are neglecting curvature effects [Krauss-Varban & Burgess, 1991]. The upstream plasma is homogeneous, so we neglect upstream waves and large scale inhomogeneity. There is also an artificial downstream barrier, which means that we cannot model downstream wave sources.
Ion scale physics is worth studying in the context of electron acceleration since it dominates the shock structure. Previous studies have shown that electrons can travel hundreds of ion inertial lengths along the shock front [Krauss-Varban & Burgess, 1991], so they will feel the effect of this structure. Electrons may, however, produce short wavelength structures which would have an effect on electron behaviour. The hybrid code therefore imposes considerable constraints, but it is a significant improvement over previous 1-D models in that it allows us to consider structure within the shock field. It should also be noted that, although we are not able to simulate field structure in the third dimension, the fact that electrons only travel significant distances in a direction parallel to field lines means that they are influenced by such structure much less than the phenomena that we are able to simulate.
shock_field
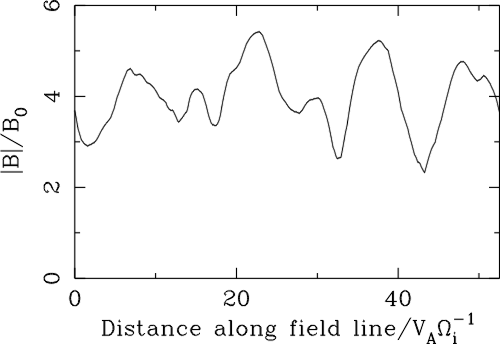
Figure 5.4: The variation of |B| along a field line running along the shock front.
Figure 5.4 shows the variation in the magnetic field along a field line passing through the shock front. The rippling of the shock front has a wavelength of a few ion inertial lengths and an amplitude in Bx of around 2B0. We have described how adiabatic theories assume that the shock structure is stationary, one-dimensional and that the electron gyroradius is much smaller than the shock thickness. In our simulations, the first two of these approximations are violated: we observe magnetic structures that can neither be approximated as stationary nor one-dimensional. These localised fluctuations in the field strength could lead to variations in the pitch angle constraints for reflection. They could also result in magnetic mirroring and, since the structure is time dependent, there also exists the possibility of First Order Fermi acceleration. In Chapter 4, we used Fourier transforms to study the power in this structure. The Fourier transforms shown in Figure 4.13 shows power over a range of w and k. This could lead to electron pitch angle scattering, which is one requirement for diffusive acceleration.
As in Chapter 4, we again use two orientations of the upstream magnetic field, B0. Electrons in the simulations with B0 pointing out of the simulation plane feel no variations associated with 2-D structure along a field line, so we expect electron trajectories to be similar to those in a 1-D simulation. This serves to validate our interpolation and integration methods. In our examples, the inflow velocity in the simulation frame is 4vA, giving a shock Alfvén Mach number MA=5.66. We use an Alfvén speed vA = 60 km  s-1 and an electron plasma beta be=0.5. These parameters are chosen to resemble conditions in the Earth's bow shock. Shock properties are a strong function of qBn, so we study two cases: qBn =85° and qBn =88°. With the two orientations of B0 this gives us four combinations of simulation parameters.
We use the Thomsen solver, with relativistic effects included, for integrating electron trajectories and bicubic interpolation for calculating the fields, as described in Chapter 3. In the light of our testing results from Section 3.3, the code uses 20 iterations per electron gyro-time (Dt = 0.05  We-1) in order to achieve high accuracy. The effect of changing this time step is discussed in Section 6.1.1. We use a computational cluster to conduct the simulations, as discussed in Appendix A. The simulations were conducted simultaneously across a number of different machines, each calculating trajectories for 5000 particles and starting with different random seeds. The number of machines available in the computational cluster varied over the course of the study, so the total number of particles in each of our simulations is correspondingly variable.
We use an initial electron energy of 100 eV, giving an initial speed of v=98.83  vA and corresponding to the tail of the solar wind halo distribution. We chose this energy because of the observation that the high energy electrons originate from the portion of the electron distribution with high perpendicular energy [Krauss-Varban et al., 1989]. In velocity space, the initial electron distribution is a uniformly covered spherical shell with a cut-off corresponding to electrons that escape upstream without interacting with the shock. This is done to reduce the computational cost of the simulation.
Escape from the shock was determined by looking at the distance from the shock in the shock normal (x) direction. The x=0 axis was considered to be the line at which the mean magnetic field, averaged over y, first reached 2 B0. This line is located at the bottom of the shock ramp and its position is largely unaffected by fluctuations in the shock structure. The electrons were initially released with a gyrocentre at x = -5.0  vAWi-1 and distributed randomly over all y so that they lay on a range of field lines. They were considered to have escaped upstream if their distance from the shock reached x £ -25.0  vAWi-1 and downstream if the distance reached x ³ 10.0  vAWi-1. The electron simulation started at t = 10  Wi-1 in order to ensure that the shock front was clear of the reflecting boundary. The simulation finished at t = 40  Wi-1 by which point only a few percent of electrons remained in the interaction region.

5.3  Electron Diagnostics

Parameters amin amax acut-off Emin Emax
qBn =85° 55° 130° 131° 100 eV 420 eV
qBn =88° 88° 138° 180° 690 eV 1.2 keV
Table 5.1: Electron distribution function parameters as derived from adiabatic theory.
Parameters Upstream Downstream In Shock
qBn =85°, adiabatic 74% 26% -
qBn =85°, B0 out of plane 73.9% 23.4% 2.7%
qBn =85°, B0 in plane 46.8% 51.7% 1.5%
qBn =88°, adiabatic 39% 61% -
qBn =88°, B0 out of plane 27.2% 71.6% 1.2%
qBn =88°, B0 in plane 3.2% 96.7% 0.1%
Table 5.2: The location of particles at the end of the simulation, compared with predictions made through adiabatic theory for a shock with Vin = 4 vA.
In our simulations, we measured an overshoot magnetic field, B1, in the range 5.1B0 to 5.5B0. In the following calculations, we assume a value of B1 = 5.2B0. We follow Krauss-Varban et al. [1989] by assuming a canonical value of 85 eV for the energy gained from the cross shock potential in the de Hoffman-Teller frame by the time the electrons reach the overshoot. We assume a constant value despite the fact that, in reality, the electric field is not conservative and the actual energy change will depend on the route taken through the shock. The energy gain is, however, less significant than the value of the overshoot magnetic field and our results are not highly sensitive to it.
Using these values, we can apply adiabatic theory to predict properties of the final electron distributions. Table 5.1 shows amin and amax, the angles between which we expect the electrons to reflect, as well as acut-off, the angle above which electrons escape upstream without interacting with the shock. The reflected population is expected to have energies between Emin and Emax. Table 5.2 shows the proportion of particles that are expected to escape upstream and downstream, together with the actual destinations from the simulations. This shows that our simulations with B0 pointing out of the simulation plane are consistent with adiabatic theory when qBn =85°.
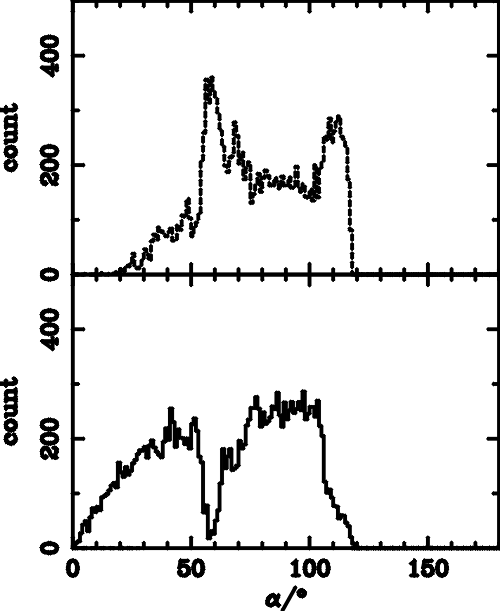
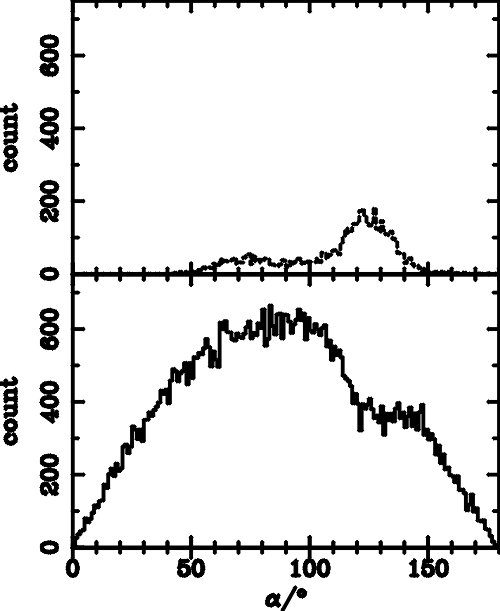
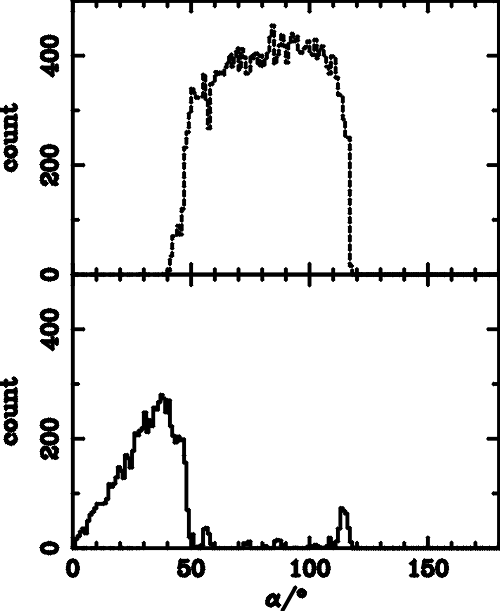
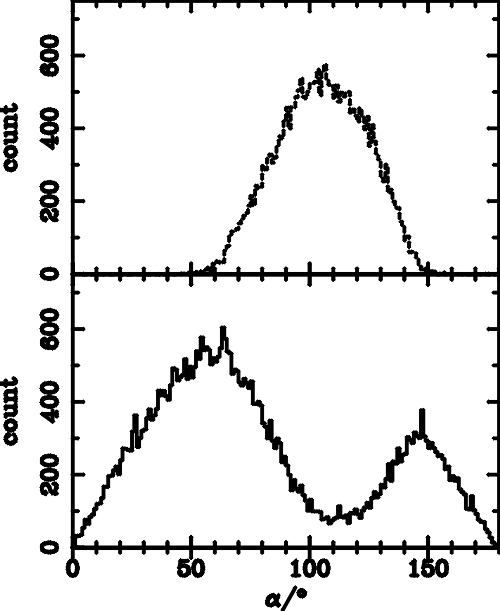
For the simulation with qBn =88°, there is a discrepancy of about 10% between the measured and theoretical values. Figure 5.5 shows how the initial pitch angle of an electron affects whether it escapes upstream or downstream. According to adiabatic theory, as described in Section 5.1.1, we would expect the transmitted and reflected populations to have sharp boundaries at the critical pitch angles. In the simulation with qBn=88° and B0 out of the simulation plane, however, the boundaries are not sharply defined. This suggests that the 10% discrepancy is either produced by variations in the cross shock potential, f, or is the result of mild variations in pitch angle, possibly as a result of interaction with upstream waves. Apart from this, both the qBn =85° and qBn =88° simulations with B0 out of the simulation plane are consistent with adiabatic theory. The simulations in which B0 lies in the simulation plane, however, are not consistent with adiabatic predictions. When the electrons are allowed to feel the 2-D shock structure, the fraction of electrons that escape upstream falls significantly. We will later show, however, that the shock structure also leads to substantially larger energy gains in both the upstream and downstream populations.
pitch_angle_85_in    pitch_angle_88_in
pitch_angle_85_out    pitch_angle_88_out
Figure 5.5: The distribution of initial pitch angle, a, for electrons that end the simulation upstream (dashed) and downstream (solid), for B0 in the simulation plane (top) and out of the simulation plane (bottom).
For B0 out of the plane, Figure 5.5 shows that reflection occurs over a range of initial pitch angles that is consistent with the predictions of adiabatic theory made in Table 5.1. When B0 is in the simulation plane, however, there are a significant number of electrons whose initial pitch angle suggests that they should reflect, but which become trapped by the shock structure and apparently dragged downstream by the convecting field lines. The peaks of reflected electrons on either side of this trapped population in the qBn =85° simulation, at pitch angles of around a = 60° and a = 110°, have parallel velocities that are so high that they are able to reflect sufficiently rapidly to avoid feeling significant magnetic structure in the upstream field.
grl_energy_spec    energy_spec_88
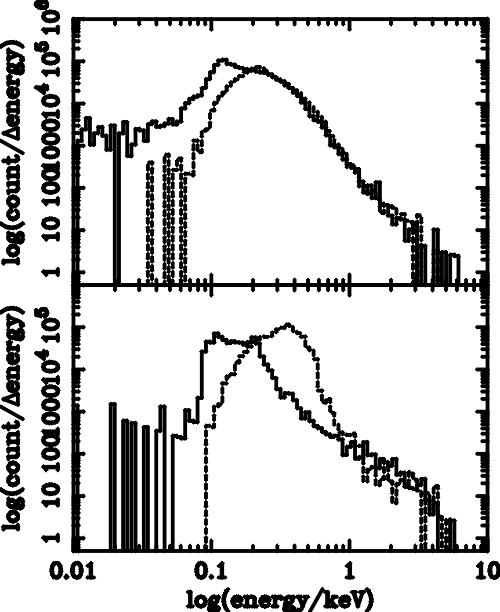
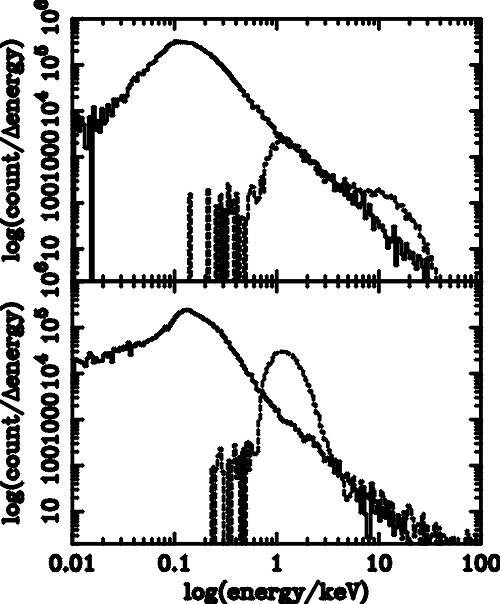
Figure 5.6: Electron differential energy spectra in the upstream plasma frame (solid lines downstream, dashed lines upstream) with B0 out of the simulation plane (bottom) and B0 in the simulation plane (top).
In order to calculate the energy and pitch angle of an electron in our simulation, we need to specify a reference frame. An electron with an energy of more than 1  eV has a velocity that is greater than the transformation velocity between any of the plasma rest frames in the simulation. We find that very few electrons have energies of less than 50  eV, so our choice of reference frame will have little impact on our results. For simplicity, therefore, we calculate electron energies and pitch angles in the initial plasma frame.
Energy spectra are shown for the upstream and downstream distributions in Figure 5.6. Again, the spectra are consistent with adiabatic theory when B0 is directed out of the simulation plane. The distributions when B0 is in the simulation plane, however, differ. The spectra show similar upstream and downstream levels with a power law tail. The slope of the power law tail is around -2 to -3, which is consistent with the observed values reported by Gosling et al. [1989] and Anderson [1981]. Although our initial electron distribution function does not mimic the full solar wind distribution, we should expect the power law index of our spectra to be similar to that at other energies. If this were not the case, the combined energy spectrum would not be consistent with the observed power law.
It is also significant that the upstream and downstream distributions are similar when B0 is in the simulation plane and electrons are allowed to feel the spatial variations in the magnetic field. This suggests that the upstream and downstream populations arise from the same source, but that the acceleration mechanism is able to release electrons into both the upstream and downstream regions.
mu_ratio_th85_in
mu_ratio_th88_in
mu_ratio_th88_out
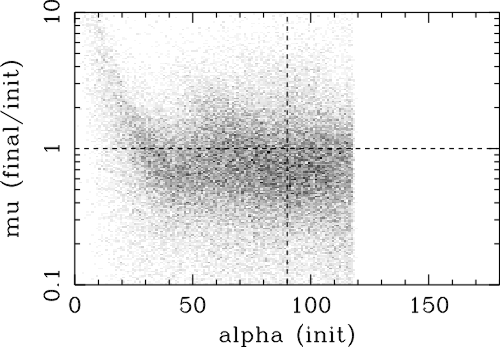
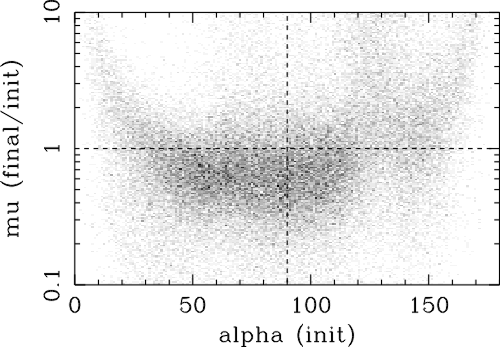
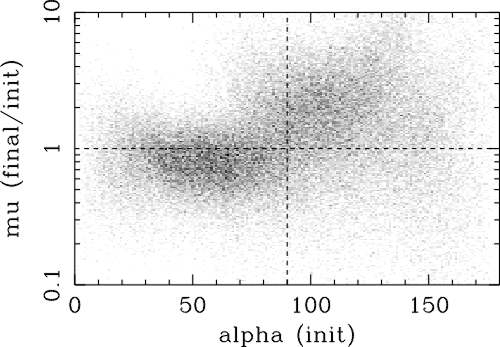
Figure 5.7: Graphs showing the degree to which magnetic moment is conserved, plotting the logarithm of the ratio of final to initial magnetic moment, log([(mfinal)/(mfinal)]), against initial pitch angle, ainit, for all electrons in the simulation.
Adiabatic theory is based on the conservation of the magnetic moment of electrons. By plotting the logarithm of the ratio of final to initial magnetic moment as a function of initial pitch angle, Figure 5.7 shows how magnetic moment in our simulation deviates from this. The range of the m ratio that we obtain is larger than that found by Krauss-Varban et al. [1989], but is consistent with the significantly larger number of particles that we use. There are two components to this variation in magnetic moment [Krauss-Varban et al., 1989]. The first is symmetric about the axis and corresponds to a scatter in perpendicular velocity. The second component corresponds to bulk perpendicular heating and is exhibited as an overall increase in m. Magnetic moment conservation is worse for low initial magnetic moments because a given amount of perpendicular heating results in a larger proportional change. At pitch angles close to 90°, the m conservation is better, with any perpendicular heating being swamped by mild scattering. There is an element of perpendicular heating in Figure 5.7(c), which corresponds to the B0 out of the plane simulation. We note that Krauss-Varban et al. [1989] also observed this in their simulations with very high values of qBn and that it is also present to a lesser extent in Figure 5.7(b). Krauss-Varban et al. [1989] state that all these pitch angle scattering effects are due to small scale deviations in the field structure of the order of the grid size. Such small scale scattering could have a physical analogue since electron processes, which are not modelled by the hybrid code, produce ripples at electron scales. These would cause a degree of scatter which is, to some extent, reproduced by the numerical effects of the grid. The extent of the scatter does not seem to depend strongly on either qBn or the direction of B0, however, so we conclude that it will have little influence on our results.
th85bp5m4c_v_cmpts
th88bp5m4a_v_cmpts     th88bp5m4b_v_cmpts
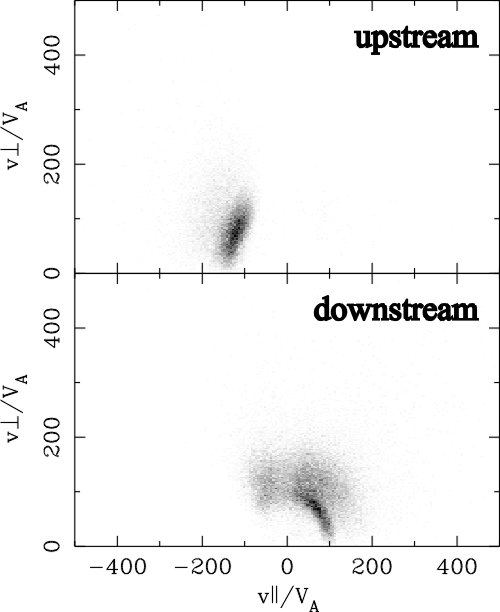
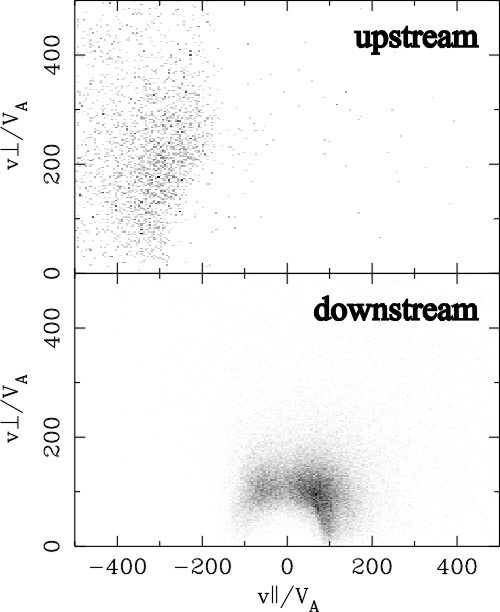
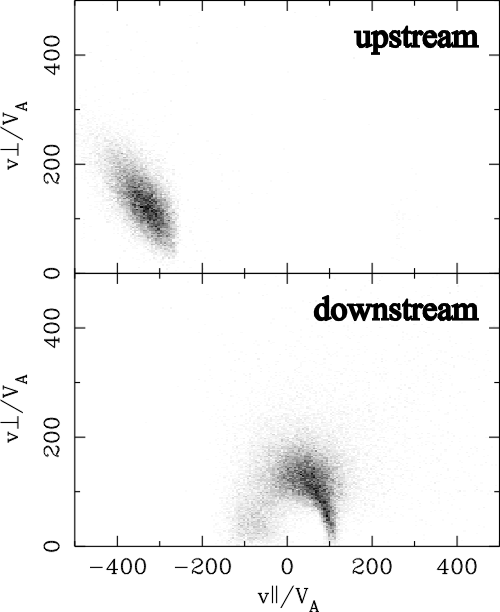
Figure 5.8: Graphs comparing the parallel and perpendicular components of the velocity at the end of the simulation for electrons that escape upstream (top) and downstream (bottom), for a variety of simulation parameters.
Figure 5.8 shows the parallel and perpendicular velocity components of electrons at the end of the simulation, although the power law nature of the energy spectra means that the highest energy particles do not show up clearly. In all cases, the downstream distribution is centred at the origin. The adiabatic theory described in Section 5.1.1 indicates that we should expect preferential acceleration of downstream electrons that have high magnetic moments. This occurs in the simulation designed to remove field structure, shown in Figure 5.8(c). Figures 5.8(a) and 5.8(b) have this structure and show much less evidence of preferential acceleration. In these cases, the downstream spectrum is better represented by a circular arc, with acceleration to a range of energies for all pitch angles. This process therefore resembles heating.
The upstream distribution in Figure 5.8(a) forms an arc in a similar manner to that seen downstream. This arc corresponds to a missing portion of the downstream distribution, which strongly suggests that pitch angle scattering within the shock has caused downstream destined electrons to scatter upstream and supports the idea that they are part of the same population. This would be consistent with the suggestion of Gosling et al. [1989] that the most energetic upstream electrons were the result of "leakage" from an accelerated downstream population.
Figure 5.8(c) shows an upstream distribution that agrees well the simulations of Krauss-Varban et al. [1989]. The distribution has a cut-off in the parallel velocity which corresponds to the minimum velocity required to escape from the shock. There is also a loss cone feature, consistent with magnetic mirroring.
The upstream population in Figure 5.8(b) has the expected cut-off in the parallel velocity, but there is also a small population of electrons that appear to have escaped upstream with a velocity below the cut-off. The origin of these electrons is not clear and it is possible that they are a numerical artefact. More likely, they may represent particles that are scattered in upstream fluctuations related to a foreshock. These electrons escape upstream in the latter half of the simulation. We show in Section 6.3 that, by this time, the energy spectrum is already well developed and these electrons will not, therefore, have an impact on our results. The upstream distribution lacks the loss cone of Figure 5.8(c). This suggests either that the upstream population either contains an element that has "leaked" from the downstream population or that pitch angle scattering has moved electrons into the loss-cone region. These results suggest that, if these results are consistent across all initial energies, structure in the shock transition can have a significant effect on the pitch angle distribution of upstream electrons that might be observable.

5.4  Electron Trajectories

track_1905     track_4045
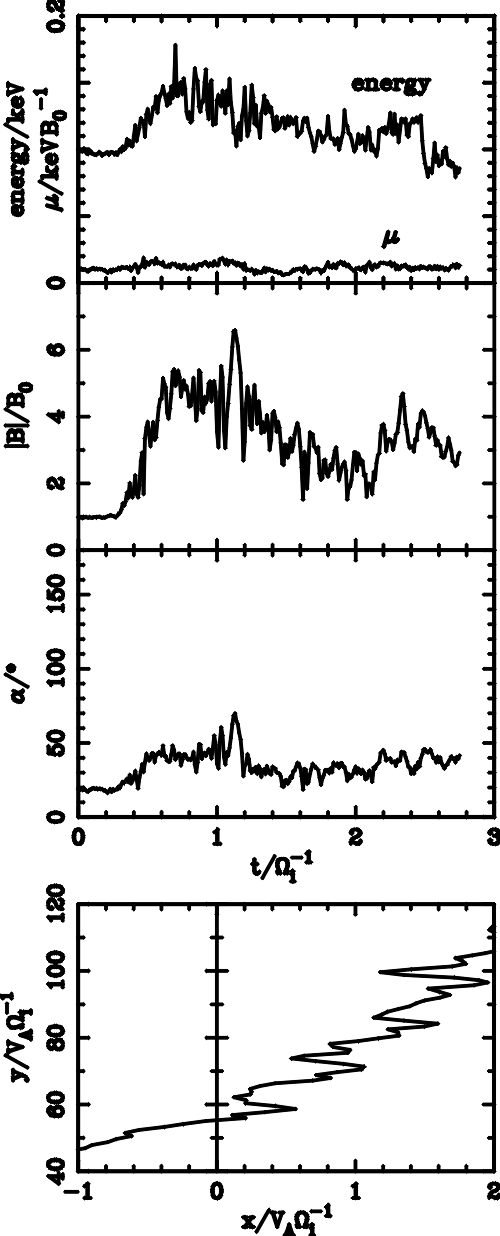
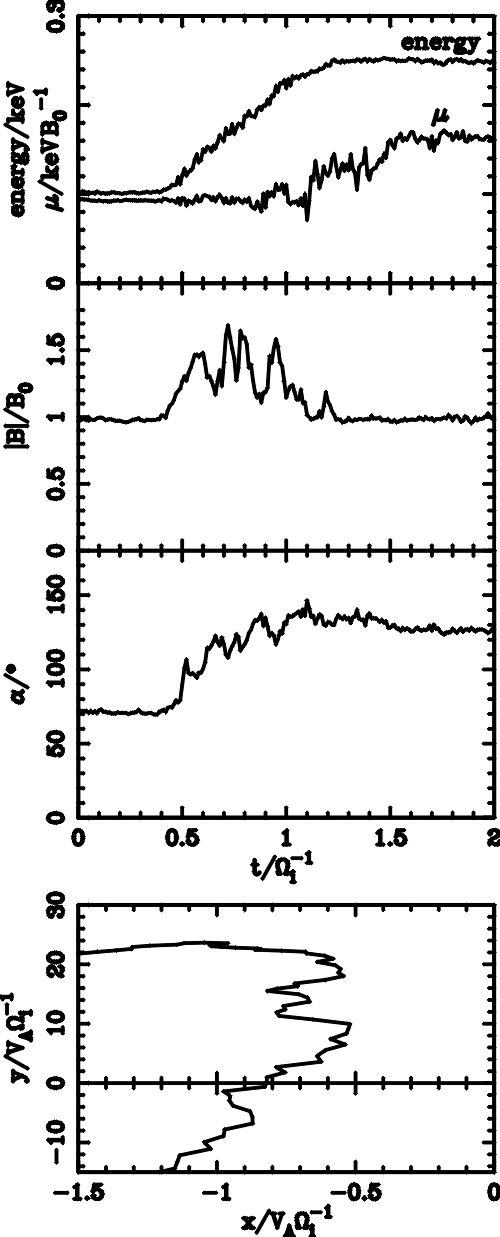
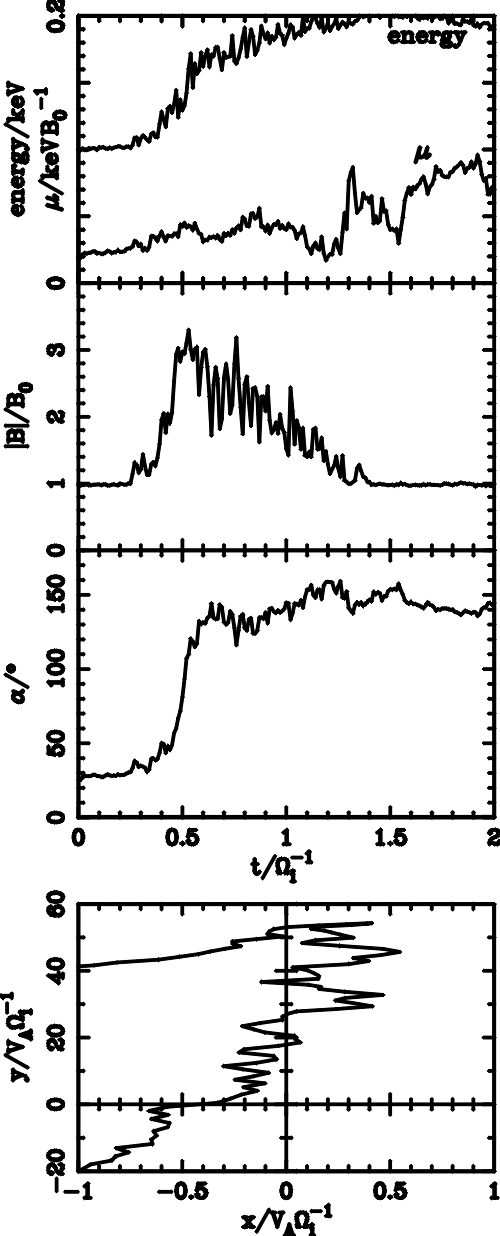
Figure 5.9: Energy, magnetic moment m, pitch angle a, total magnetic field |B| and spatial trajectories for two electrons whose acceleration is consistent with adiabatic theory.
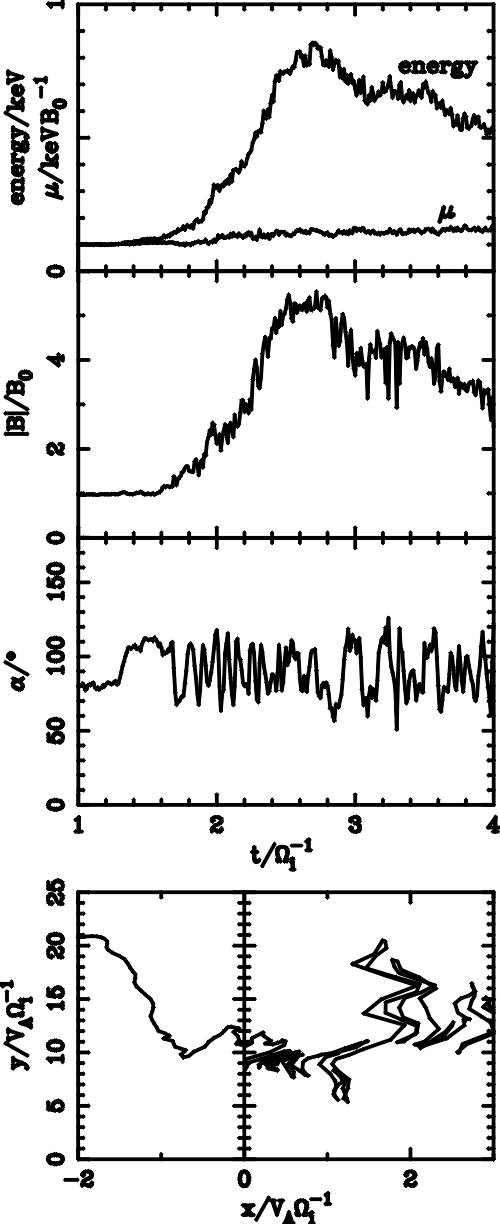
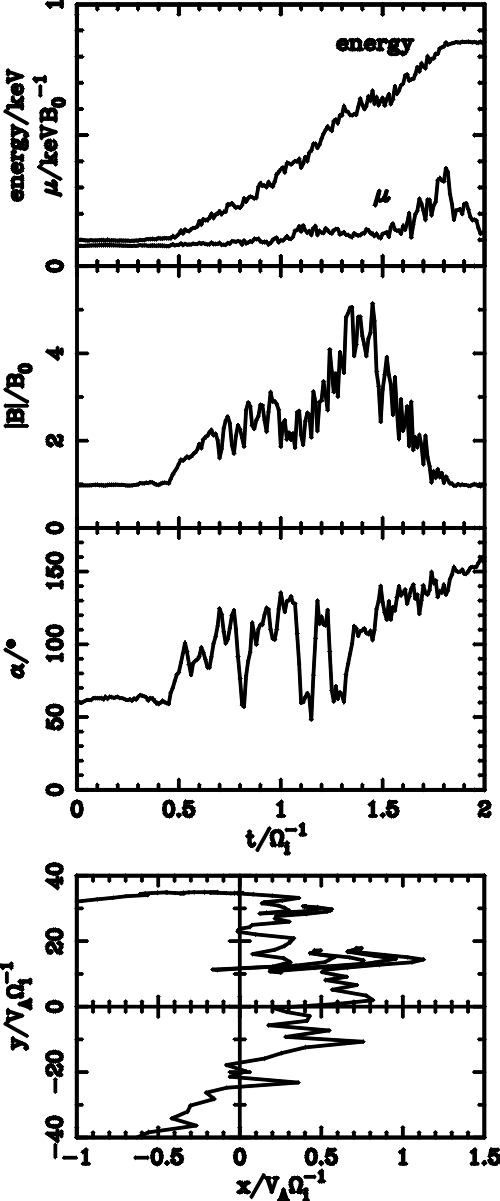
Figures 5.9, 5.10 and 5.11 show the trajectories of test particle electrons in the qBn=85° simulation with the upstream magnetic field in the simulation plane. The electron gyroradius is around 0.05 vA Wi-1 and is not resolved. We did not observe any resonance between the test particle electron trajectories and the width of the simulation box. In two dimensions, the field lines are not straight, so a particle travelling along a field line will have a fluctuating x position co-ordinate, even if it is not reflecting. We find that electrons interacting with the shock structure may either behave adiabatically or become trapped within the shock structure. Electrons that have undergone such trapping can experience significant additional acceleration. They may escape either upstream or downstream of the shock and, unlike the adiabatic electrons, their final destination is not determined by their initial pitch angle.
Figure 5.9 shows two examples of electrons that behave in a manner consistent with adiabatic theory. Both cases show x spatial co-ordinate fluctuation due to the curvature of field lines. Figure 5.9(a) illustrates the adiabatic transmission of an electron. The electron energy rises in the shock transition as a result of the shock potential and is consistent with our assumed canonical value of 85 eV for the acceleration by the shock potential at the overshoot. Some of this energy is lost on leaving the shock, however, as the shock overshoot is a potential maximum. This particle shows good magnetic moment conservation and behaves in a manner consistent with adiabatic theory. Figure 5.9(b) shows the trajectory of an adiabatically reflected electron. Again, the x co-ordinate fluctuates, but there is also one true reflection which is confirmed by the abrupt change in pitch angle, a, across the a = 90° axis. On this occasion, the energy gained from the shock upon reflection is large compared to the energy gain from the shock's potential. The electron's magnetic moment is conserved to within around 10 % during the reflection and acceleration. Upon leaving the shock, the magnetic moment increases by around 60 %, although there is no corresponding rise in the total energy. This is probably the result of scattering off waves in the foreshock region and, apart from this, the electron behaviour is as expected from adiabatic theory.
track_grl     track_0853
Figure 5.10: Energy, magnetic moment m, pitch angle a, total magnetic field |B| and spatial trajectories for two electrons that become trapped in the shock structure.
Figure 5.10 shows the trajectories of two electrons whose energy upon escaping the shock is significantly larger than predicted. They also show reasonable magnetic moment conservation, to within a factor of two during the shock transition, which is dramatically smaller than the increase in energy. In Figure 5.10(a) the electron is transmitted by the shock, despite starting with a pitch angle that, according to adiabatic theory, means that it should reflect. It shows an eight-fold increase in energy, which allows the magnetic moment to be conserved during the shock crossing. The magnetic field felt by the electrons shows how the particle is initially trapped whilst it is feeling a low magnetic field, consistent with the fact that it would be expected to reflect back upstream. The pitch angle scatters back and forth around a = 90°, consistent with the electron being held within a magnetic trap.
The electron in Figure 5.10(b) reflects as expected, but its interaction with the shock is similarly complicated. The spatial trajectory of the electrons show how they are trapped between field fluctuations whilst traversing the shock. The electrons are reflected many times and are effectively dragged downstream with the magnetic field. These electrons are being trapped by the two dimensional magnetic field structure at the shock ramp and overshoot. This explains the dramatic increase in energy since, as the field structure is in motion, the electrons can gain energy by Fermi acceleration. Also, we showed in Chapter 4 that the dispersion relation for shock ripples indicates that waves travel in both directions along the shock ramp. It is therefore possible that collapsing magnetic traps may be formed, which could give rise to First Order Fermi acceleration of the electrons. The increased time that the electron spends at the shock front will also mean that it can pick up additional energy by drifting along the motional electric field.
track_0144     track_3537
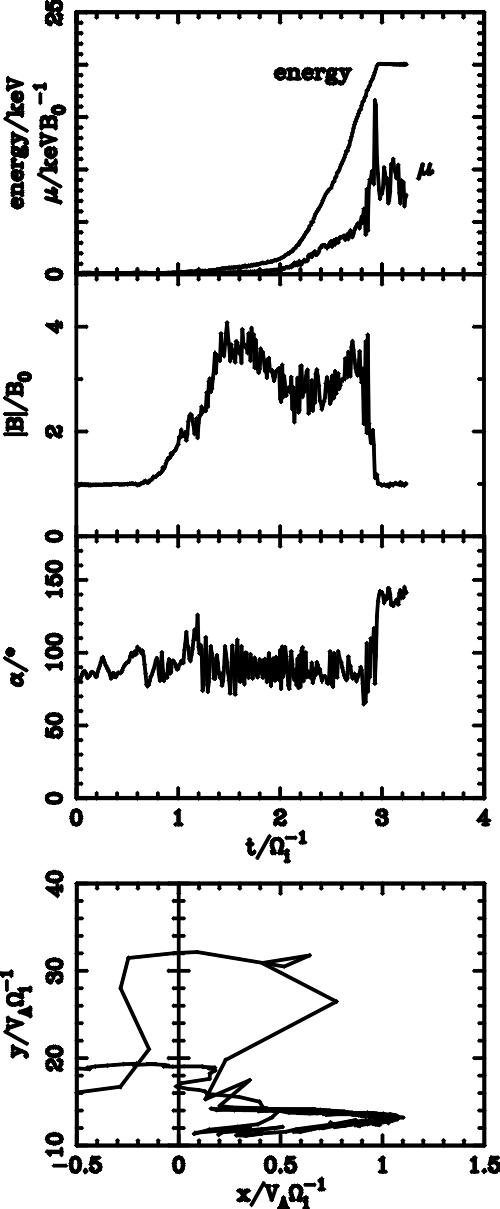
Figure 5.11: Energy, magnetic moment m, pitch angle a, total magnetic field |B| and spatial trajectories for two electrons that show unusual behaviour. We believe that Figure (a) is subject to numerical inaccuracies for t >~2 Wi-1.
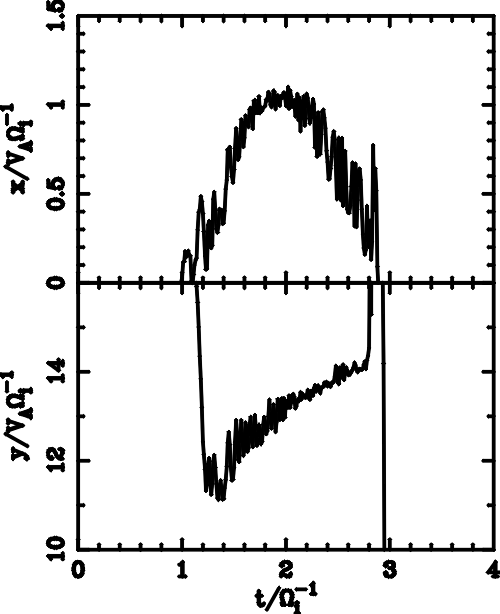
Figure 5.11 shows two electron trajectories with unusual features. Figure 5.11(a) is interesting because it has the highest final energy (20 keV) of any electron in our simulation. It is therefore a strong candidate for acceleration by a First Order Fermi process. Whilst trapped in the shock front, the electron's energy increases at a growing rate. This would be consistent with a collapsing trap since the continual increase in the electron's speed, combined with a reduction in the distance between reflections, would reduce the time between collisions. The electron also shows a slower growth in magnetic moment. The spatial trajectory and pitch angle graphs confirm that this acceleration took place in a confined region during which multiple reflections occurred.
track_0144_xy
Figure 5.12: Graph showing how the electron in Figure 5.11(a) is trapped in the shock transition twice.
Figure 5.12 provides a closer look at the trajectory of this electron. The dramatic acceleration may be explained by the fact that the electron actually passes through the shock transition twice. Initially, the electron is trapped whilst convecting downstream with the field line and experiences an order of magnitude increase in energy. This part of the acceleration process is similar to that seen for the majority of downstream trapped electrons and, in the period 1.2 Wi-1 <~t <~2 Wi-1, the electron is clearly reflecting within a collapsing magnetic trap. Upon leaving the trap, however, the electron has sufficient parallel velocity to escape upstream. The electron then passes through the shock again and becomes trapped for a second time, receiving a second order of magnitude increase in energy, corresponding to the period t >~2 Wi-1 in Figure 5.11(a). This behaviour explains the high energy shoulder to the upstream part of the trapped population as seen in Figure 5.3. This is probably due to numerical effects related to the fact that the reflection time becomes comparable with the electron time step, as discussed in Section 6.1.1.
Figure 5.11(b) shows the trajectory of a reflected electron whose initial pitch angle indicates that it should have transmitted. The pitch angle graph shows that the electron did not become trapped in the shock structure. The electron also did not encounter anomalously high magnetic field strengths as a result of rippling. The magnetic moment, however, had doubled by the time the electron reflected. The electron started with a relatively small pitch angle, so scattering by upstream fluctuations could cause relatively large changes to the magnetic moment. The origin of these fluctuations is likely to be related to those that caused the small population of upstream electrons above the velocity cut-off in Figure 5.8(b). This means that electrons that reflects upstream when they are expected to transmit could be the result of either upstream fluctuations related to a foreshock or numerical noise in the hybrid code. Such electrons do not, however, form a significant part of the trapped population, which appears to be composed of electrons whose initial parameters suggest that they should reflect.

5.4.1  Trapped population

The electrons that behave adiabatically may be divided into upstream and downstream populations. These populations do not require the existence of structure in the shock front and they have relatively little interaction with the 2-D structure of the shock. The upstream population is produced by a single reflection at the shock front and the downstream population passes directly through the shock. These electrons do not experience trapping or other significant effects as a result of structure in the shock front. There will, however, be a small population that are reflected (or transmitted) because they encounter higher (or lower) than average values of the magnetic field strength due to the rippling. This effect does not produce significant additional energisation, as the electrons otherwise behave according to adiabatic predictions, although this will affect the fraction of particles that are reflected.
There is, however, an additional population that exists only in the case where electrons can feel the 2-D shock structure. It arises from trapping by the ripples at the shock front. None of the electrons in this population behave according to adiabatic predictions and their final destination cannot be determined from their initial parameters. Instead, the direction of escape is determined only after the acceleration phase. Electrons with a sufficiently negative parallel velocity component are reflected back upstream whilst the other electrons convect downstream with the field lines. An electron that is dragged through the shock in this way will reflect many times and may experience considerable Fermi acceleration, either between ripples or between a ripple and the shock overshoot. This is similar to the acceleration of particles in a wave field, so the acceleration mechanism may have elements in common with the theory of stochastic acceleration described in Section 2.4.1.
The dispersion relation for ripples found in Chapter 4, however, suggests that ripples can travel in both directions along the shock front. This would lead to the formation of collapsing magnetic traps, which could result in considerable first order Fermi acceleration [Gisler & Lemons, 1990]. This scenario is evident in our example electron trajectories. The model for diffusive shock acceleration described in Section 2.4.3 also produces first order Fermi acceleration. We showed that this leads to a power law energy spectrum, which may explain the fact that our simulations also appear to produce power law spectra.
Electrons with a high magnetic moment are reflected away from the regions of high field created by the ripples and towards the regions of reduced field. They are therefore trapped whilst initially feeling a lower magnetic field than they would in the case of no rippling. This means that, if rippling exists, the minimum value of B1/B0 is important, as well as the maximum value. This reflection and trapping by the shock structure means that the distance travelled along the shock by highly energetic electrons is reduced to <~50  vAWi-1, when compared to the value of 1000  vAWi-1 found by Krauss-Varban [1994] in the case of a 1-D shock. This substantially reduces the importance of the bow shock's radius of curvature (Rc » 5000  vA Wi-1) suggested by Krauss-Varban [1994].

5.5  Summary

Hybrid simulations in 2-D have ripples in the fields that move along the shock front at the overshoot Alfvén speed. We have shown that the suprathermal portion of the electron distribution function is heavily dependent on 2-D shock structure. This structure provides a mechanism to accelerate electrons to high energies, producing a field aligned beam upstream and a substantial downstream population in agreement with observations near Earth's bow shock. The high energy tail of the electron energy spectrum is similar for both the upstream and downstream populations, with a power law tail that is also consistent with observations. For the shocks investigated, the fraction of reflected electrons is reduced compared to the predictions of adiabatic reflection. In Chapter 6 we will investigate how the production of suprathermal electrons depends on shock properties at the Earth's bow shock and in solar flares.


Page Maintained By : Rob Lowe
Last Revision : 1st March 2003